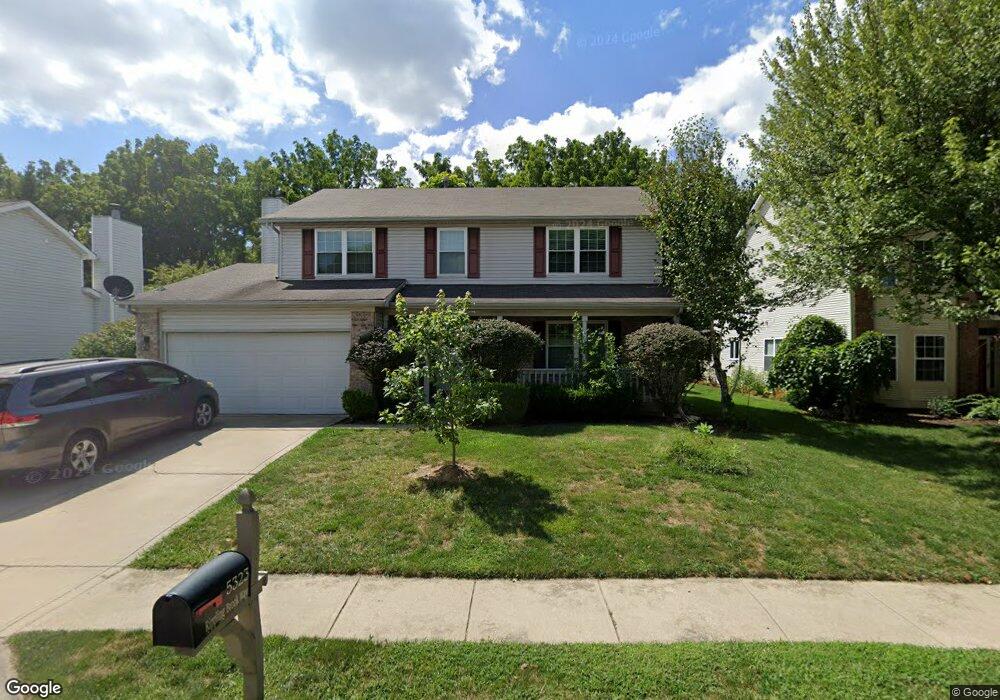
5323 Ripplingbrook Way Carmel, IN 46033
East Carmel NeighborhoodEstimated Value: $462,000 - $478,000
4
Beds
3
Baths
3,280
Sq Ft
$143/Sq Ft
Est. Value
About This Home
This home is located at 5323 Ripplingbrook Way, Carmel, IN 46033 and is currently estimated at $470,268, approximately $143 per square foot. 5323 Ripplingbrook Way is a home located in Hamilton County with nearby schools including Cherry Tree Elementary School, Clay Middle School, and Carmel High School.
Ownership History
Date
Name
Owned For
Owner Type
Purchase Details
Closed on
Jun 24, 2019
Sold by
Sun Yue
Bought by
Aydin Huseyin L and Aydin Ayse Aisha
Current Estimated Value
Home Financials for this Owner
Home Financials are based on the most recent Mortgage that was taken out on this home.
Original Mortgage
$240,435
Outstanding Balance
$211,486
Interest Rate
4.12%
Mortgage Type
FHA
Estimated Equity
$258,782
Purchase Details
Closed on
Nov 19, 2012
Sold by
Kaprove Matthew and Kaprove Amanda
Bought by
Sun Yue
Home Financials for this Owner
Home Financials are based on the most recent Mortgage that was taken out on this home.
Original Mortgage
$156,750
Interest Rate
3.38%
Mortgage Type
New Conventional
Purchase Details
Closed on
May 8, 2009
Sold by
Gaede Scott J and Shore Julieanne M
Bought by
Kaprove Matthew and Kaprove Amanda
Home Financials for this Owner
Home Financials are based on the most recent Mortgage that was taken out on this home.
Original Mortgage
$173,700
Interest Rate
4.84%
Mortgage Type
Purchase Money Mortgage
Create a Home Valuation Report for This Property
The Home Valuation Report is an in-depth analysis detailing your home's value as well as a comparison with similar homes in the area
Home Values in the Area
Average Home Value in this Area
Purchase History
| Date | Buyer | Sale Price | Title Company |
|---|---|---|---|
| Aydin Huseyin L | -- | Chicago Title Company Llc | |
| Sun Yue | -- | None Available | |
| Kaprove Matthew | -- | None Available |
Source: Public Records
Mortgage History
| Date | Status | Borrower | Loan Amount |
|---|---|---|---|
| Open | Aydin Huseyin L | $240,435 | |
| Previous Owner | Sun Yue | $156,750 | |
| Previous Owner | Kaprove Matthew | $173,700 |
Source: Public Records
Tax History Compared to Growth
Tax History
| Year | Tax Paid | Tax Assessment Tax Assessment Total Assessment is a certain percentage of the fair market value that is determined by local assessors to be the total taxable value of land and additions on the property. | Land | Improvement |
|---|---|---|---|---|
| 2024 | $3,951 | $404,600 | $93,800 | $310,800 |
| 2023 | $3,951 | $374,600 | $87,200 | $287,400 |
| 2022 | $3,671 | $322,500 | $87,200 | $235,300 |
| 2021 | $3,053 | $274,800 | $87,200 | $187,600 |
| 2020 | $3,118 | $279,600 | $87,200 | $192,400 |
| 2019 | $3,080 | $278,700 | $42,100 | $236,600 |
| 2018 | $5,011 | $245,200 | $42,100 | $203,100 |
| 2017 | $4,732 | $232,300 | $42,100 | $190,200 |
| 2016 | $4,654 | $226,200 | $42,100 | $184,100 |
| 2014 | $4,346 | $222,100 | $36,200 | $185,900 |
| 2013 | $4,346 | $213,400 | $36,200 | $177,200 |
Source: Public Records
Map
Nearby Homes
- 5325 Creekbend Dr
- 14564 White Hall Cir
- 5522 White Hall Way
- 14304 Woodfield Dr S
- 5989 Ashmore Ln
- 5703 Polk Dr
- 5703 Polk Dr Unit 203
- 5310 Gray Eagle Ct
- 5712 Polk Dr
- 5676 Polk Dr
- 6144 Burleigh Place
- 14831 Drayton Dr
- 5812 Bluestem Ct
- 5474 Cayman Ct
- 14886 Redcliff Dr
- 5808 Corralberry Ct
- 13789 Stone Haven Dr
- 15067 Carrick Rd
- 4929 Deer Ridge Dr S
- 5175 Montview Way
- 5323 Rippling Brook Way
- 5325 Rippling Brook Way
- 5321 Ripplingbrook Way
- 5327 Rippling Brook Way
- 5327 Ripplingbrook Way
- 5324 Rippling Brook Way
- 5324 Ripplingbrook Way
- 5319 Rippling Brook Way
- 5326 Rippling Brook Way
- 5319 Ripplingbrook Way
- 5322 Ripplingbrook Way
- 14208 Hazel Dell Pkwy
- 5326 Ripplingbrook Way
- 5328 Rippling Brook Way
- 5329 Rippling Brook Way
- 5329 Ripplingbrook Way
- 5328 Ripplingbrook Way
- 5320 Rippling Brook Way
- 5320 Ripplingbrook Way