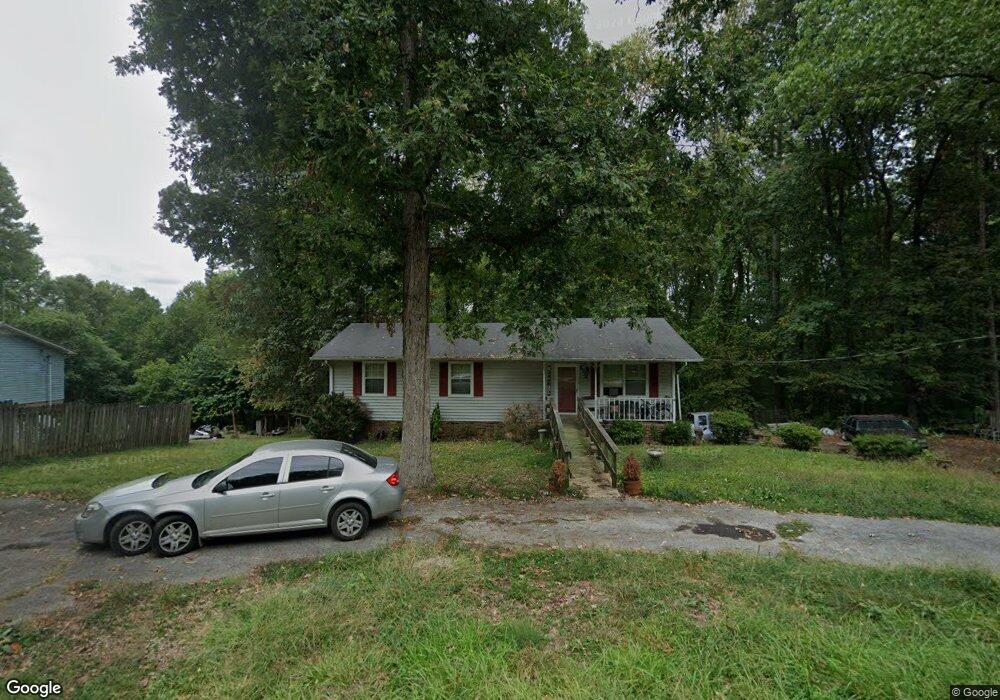
5324 Dodson Branch Rd Cookeville, TN 38501
Estimated Value: $226,616 - $320,000
--
Bed
2
Baths
1,344
Sq Ft
$199/Sq Ft
Est. Value
About This Home
This home is located at 5324 Dodson Branch Rd, Cookeville, TN 38501 and is currently estimated at $267,154, approximately $198 per square foot. 5324 Dodson Branch Rd is a home located in Putnam County with nearby schools including Cookeville High School, Northeast Elementary School, and Algood Middle School.
Ownership History
Date
Name
Owned For
Owner Type
Purchase Details
Closed on
Sep 17, 2004
Sold by
Dyer Ronnie K and Dyer Cynthia G
Bought by
Ricardo Cartwright and Ricardo Amanda
Current Estimated Value
Home Financials for this Owner
Home Financials are based on the most recent Mortgage that was taken out on this home.
Original Mortgage
$88,000
Outstanding Balance
$51,284
Interest Rate
5.73%
Estimated Equity
$215,870
Purchase Details
Closed on
Jul 21, 1999
Sold by
Hamm Dennis D
Bought by
Dyer Ronnie K and Dyer Cynthia G
Purchase Details
Closed on
Mar 29, 1993
Bought by
Hamm Dennis D
Purchase Details
Closed on
Feb 28, 1991
Bought by
Biehl Kevin C Denise
Purchase Details
Closed on
Jul 29, 1988
Bought by
Ladd Bruce Allen & Heritage Federal Savi
Purchase Details
Closed on
Jun 15, 1987
Bought by
Betty Garrison V and Betty Jo
Create a Home Valuation Report for This Property
The Home Valuation Report is an in-depth analysis detailing your home's value as well as a comparison with similar homes in the area
Home Values in the Area
Average Home Value in this Area
Purchase History
| Date | Buyer | Sale Price | Title Company |
|---|---|---|---|
| Ricardo Cartwright | $88,500 | -- | |
| Dyer Ronnie K | $74,900 | -- | |
| Hamm Dennis D | $67,000 | -- | |
| Biehl Kevin C Denise | $56,000 | -- | |
| Ladd Bruce Allen & Heritage Federal Savi | -- | -- | |
| Betty Garrison V | -- | -- |
Source: Public Records
Mortgage History
| Date | Status | Borrower | Loan Amount |
|---|---|---|---|
| Open | Betty Garrison V | $88,000 |
Source: Public Records
Tax History Compared to Growth
Tax History
| Year | Tax Paid | Tax Assessment Tax Assessment Total Assessment is a certain percentage of the fair market value that is determined by local assessors to be the total taxable value of land and additions on the property. | Land | Improvement |
|---|---|---|---|---|
| 2024 | $964 | $36,225 | $6,450 | $29,775 |
| 2023 | $964 | $36,225 | $6,450 | $29,775 |
| 2022 | $895 | $36,225 | $6,450 | $29,775 |
| 2021 | $944 | $38,200 | $6,450 | $31,750 |
| 2020 | $696 | $38,200 | $6,450 | $31,750 |
| 2019 | $696 | $23,775 | $6,100 | $17,675 |
| 2018 | $649 | $23,775 | $6,100 | $17,675 |
| 2017 | $649 | $23,775 | $6,100 | $17,675 |
| 2016 | $649 | $23,775 | $6,100 | $17,675 |
| 2015 | $667 | $23,775 | $6,100 | $17,675 |
| 2014 | $662 | $23,594 | $0 | $0 |
Source: Public Records
Map
Nearby Homes
- 5546 Emerald Rd
- 4882 Emerald Rd
- 5585 Emerald Rd
- 5557 Emerald Rd
- 5757 Emerald Rd
- 5900 Dodson Branch Rd
- 6180 Bob Lynn Rd
- 6950 Dodson Branch Rd
- 1704 Timber Trail
- 7030 Dodson Branch Rd
- 447 W Bangham Rd
- 00 Dodson Branch Rd
- 1190 N Allen Rd
- 1069 Mcgregor Ln
- 1748 Timber Trail
- 1058 Mcgregor Ln
- 3112 Shipley Rd
- 2220 SE Crag Rock
- 727 Hutcheson Rd
- 5302 Dodson Branch Rd
- 5336 Dodson Branch Rd Unit 1
- 5336 Dodson Branch Rd
- 5336 Dodson Branch Rd Unit 3
- 5336 Dodson Branch Rd Apt1
- 5288 Dodson Branch Rd
- 5344 Dodson Branch Rd
- 5344 Dodson Branch Rd Unit 2
- 5344 Dodson Branch Rd
- 5350 Dodson Branch Rd Unit 4
- 5350 Dodson Branch Rd
- 5260 Dodson Branch Rd
- 5238 Dodson Branch Rd
- 5220 Dodson Branch Rd
- 4500 Emerald Rd
- 1039 Johnnie Bud Ln
- 4556 Emerald Rd
- 5200 Dodson Branch Rd
- 1117 Johnnie Bud Ln
- 1037 Johnnie Bud Ln