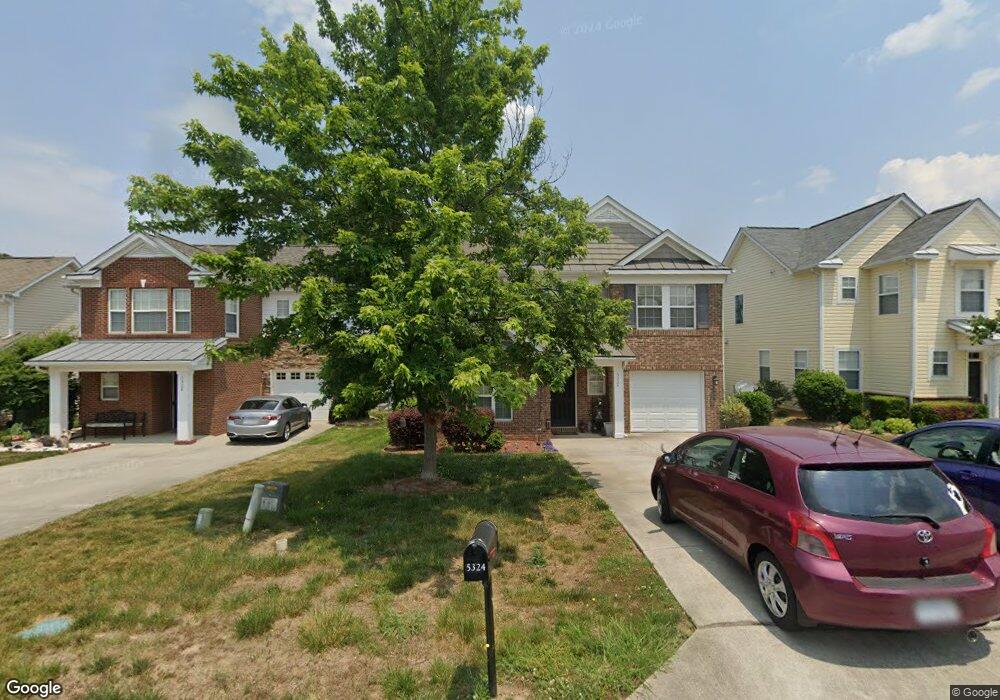
5324 Meryton Park Way Raleigh, NC 27616
Forestville NeighborhoodEstimated Value: $386,000 - $418,000
3
Beds
3
Baths
2,274
Sq Ft
$175/Sq Ft
Est. Value
About This Home
This home is located at 5324 Meryton Park Way, Raleigh, NC 27616 and is currently estimated at $398,024, approximately $175 per square foot. 5324 Meryton Park Way is a home located in Wake County with nearby schools including Wildwood Forest Elementary, East Millbrook Middle, and Wakefield High School.
Ownership History
Date
Name
Owned For
Owner Type
Purchase Details
Closed on
Oct 4, 2010
Sold by
Secretary Of Housing & Urban Development
Bought by
Better Homes Llc
Current Estimated Value
Home Financials for this Owner
Home Financials are based on the most recent Mortgage that was taken out on this home.
Original Mortgage
$100,000
Outstanding Balance
$66,224
Interest Rate
4.42%
Mortgage Type
Future Advance Clause Open End Mortgage
Estimated Equity
$331,800
Purchase Details
Closed on
May 12, 2010
Sold by
Ho Hien Dieu Thi and Chu Nam
Bought by
Secretary Of Housing & Urban Development
Purchase Details
Closed on
Mar 31, 2006
Sold by
Kb Home Raleigh Durham Llc
Bought by
Ho Hien Dieu Thi and Chu Nam
Home Financials for this Owner
Home Financials are based on the most recent Mortgage that was taken out on this home.
Original Mortgage
$186,607
Interest Rate
6.25%
Mortgage Type
FHA
Purchase Details
Closed on
Sep 28, 2004
Sold by
Thorton Ventures Llc
Bought by
Kb Home Raleigh Durham Llc
Create a Home Valuation Report for This Property
The Home Valuation Report is an in-depth analysis detailing your home's value as well as a comparison with similar homes in the area
Home Values in the Area
Average Home Value in this Area
Purchase History
| Date | Buyer | Sale Price | Title Company |
|---|---|---|---|
| Better Homes Llc | -- | None Available | |
| Secretary Of Housing & Urban Development | $199,541 | None Available | |
| Ho Hien Dieu Thi | $188,500 | None Available | |
| Kb Home Raleigh Durham Llc | $1,089,000 | -- |
Source: Public Records
Mortgage History
| Date | Status | Borrower | Loan Amount |
|---|---|---|---|
| Open | Better Homes Llc | $100,000 | |
| Previous Owner | Ho Hien Dieu Thi | $186,607 |
Source: Public Records
Tax History Compared to Growth
Tax History
| Year | Tax Paid | Tax Assessment Tax Assessment Total Assessment is a certain percentage of the fair market value that is determined by local assessors to be the total taxable value of land and additions on the property. | Land | Improvement |
|---|---|---|---|---|
| 2025 | -- | $400,629 | $80,000 | $320,629 |
| 2024 | $3,499 | $400,629 | $80,000 | $320,629 |
| 2023 | $2,546 | $231,774 | $42,000 | $189,774 |
| 2022 | $2,367 | $231,774 | $42,000 | $189,774 |
| 2021 | $2,275 | $231,774 | $42,000 | $189,774 |
| 2020 | $2,234 | $231,774 | $42,000 | $189,774 |
| 2019 | $2,200 | $188,078 | $30,000 | $158,078 |
| 2018 | $2,075 | $188,078 | $30,000 | $158,078 |
| 2017 | $1,977 | $188,078 | $30,000 | $158,078 |
| 2016 | $0 | $188,078 | $30,000 | $158,078 |
| 2015 | -- | $200,790 | $36,000 | $164,790 |
| 2014 | -- | $200,790 | $36,000 | $164,790 |
Source: Public Records
Map
Nearby Homes
- 8911 Elizabeth Benneth Place
- 5126 Thornton Knoll Way
- 8857 Thornton Town Place
- 5163 Sandy Banks Rd
- SYDNEY Plan at Thornton Townes
- JONATHAN Plan at Thornton Townes
- 8947 Commons Townes Dr
- 5107 Sandy Banks Rd
- 8957 Commons Townes Dr
- 5121 Neuse Commons Ln
- 8640 Neuse Landing Ln Unit 110
- 8707 River Keeper Way
- 8885 Commons Townes Dr
- 8610 Neuse Landing Ln Unit 103
- 8620 Neuse Club Ln Unit 111
- 8620 Neuse Club Ln Unit 107
- 8702 Neuse Town Dr
- 8537 Beckett Chase Way
- 8535 Beckett Chase Way
- 8529 Beckett Chase Way
- 5324 Meryton Pkwy
- 5328 Meryton Park Way
- 5328 Meryton Pkwy
- 5320 Meryton Pkwy
- 5332 Meryton Park Way
- 5332 Meryton Pkwy
- 5316 Meryton Pkwy
- 5316 Meryton Park Way
- 5336 Meryton Park Way
- 5336 Meryton Pkwy
- 5312 Meryton Pkwy
- 5312 Meryton Park Way
- 5329 Meryton Pkwy
- 5325 Meryton Pkwy
- 5340 Meryton Pkwy
- 5329 Meryton Park Way
- 5340 Meryton Park Way
- 5321 Meryton Pkwy
- 5317 Meryton Park Way
- 5333 Meryton Pkwy