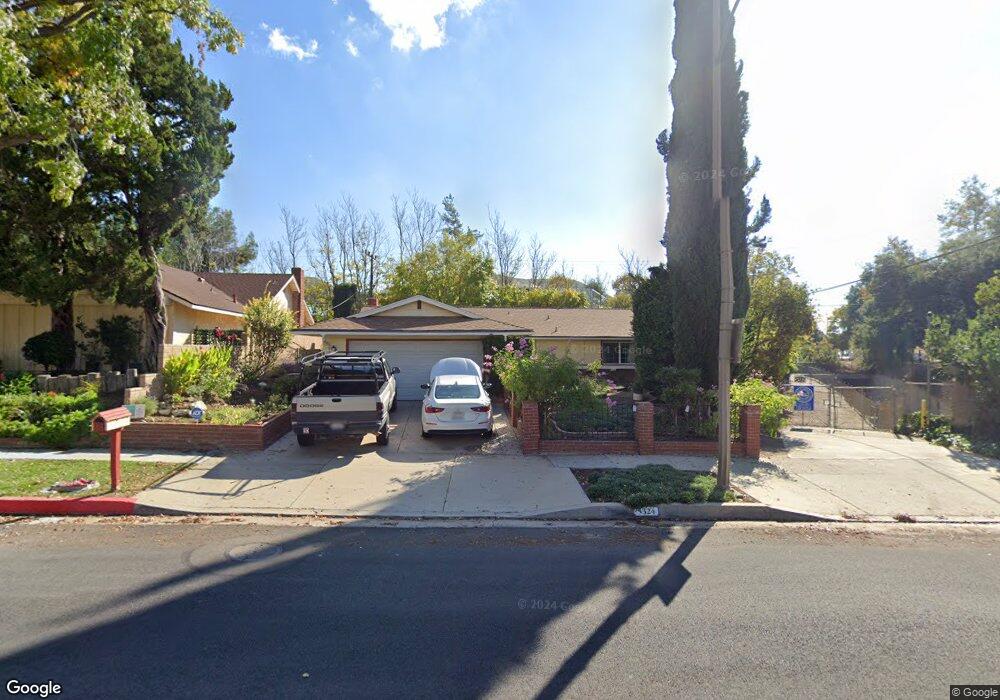
5324 Parkmor Rd Calabasas, CA 91302
Estimated Value: $1,122,000 - $1,810,000
5
Beds
2
Baths
2,050
Sq Ft
$650/Sq Ft
Est. Value
About This Home
This home is located at 5324 Parkmor Rd, Calabasas, CA 91302 and is currently estimated at $1,332,919, approximately $650 per square foot. 5324 Parkmor Rd is a home located in Los Angeles County with nearby schools including Lupin Hill Elementary, Arthur E. Wright Middle School, and Calabasas High School.
Ownership History
Date
Name
Owned For
Owner Type
Purchase Details
Closed on
Jul 29, 2003
Sold by
Messenger Jeffrey C and Alet Frances M
Bought by
Messenger Jeffrey C and Alet Frances M
Current Estimated Value
Home Financials for this Owner
Home Financials are based on the most recent Mortgage that was taken out on this home.
Original Mortgage
$205,000
Interest Rate
5.29%
Mortgage Type
Purchase Money Mortgage
Purchase Details
Closed on
Oct 1, 1999
Sold by
Messenger Jeffrey C
Bought by
Messenger Jeffrey C and Alet Frances M
Purchase Details
Closed on
May 12, 1997
Sold by
Schikal Paul F and Schikal Beryl M
Bought by
Messenger Jeffrey C and Alet Frances M
Home Financials for this Owner
Home Financials are based on the most recent Mortgage that was taken out on this home.
Original Mortgage
$209,000
Interest Rate
7.98%
Create a Home Valuation Report for This Property
The Home Valuation Report is an in-depth analysis detailing your home's value as well as a comparison with similar homes in the area
Home Values in the Area
Average Home Value in this Area
Purchase History
| Date | Buyer | Sale Price | Title Company |
|---|---|---|---|
| Messenger Jeffrey C | -- | -- | |
| Messenger Jeffrey C | -- | -- | |
| Messenger Jeffrey C | $239,000 | First American Title Co |
Source: Public Records
Mortgage History
| Date | Status | Borrower | Loan Amount |
|---|---|---|---|
| Closed | Messenger Jeffrey C | $205,000 | |
| Closed | Messenger Jeffrey C | $209,000 |
Source: Public Records
Tax History Compared to Growth
Tax History
| Year | Tax Paid | Tax Assessment Tax Assessment Total Assessment is a certain percentage of the fair market value that is determined by local assessors to be the total taxable value of land and additions on the property. | Land | Improvement |
|---|---|---|---|---|
| 2025 | $4,808 | $389,230 | $150,315 | $238,915 |
| 2024 | $4,808 | $381,599 | $147,368 | $234,231 |
| 2023 | $4,630 | $374,118 | $144,479 | $229,639 |
| 2022 | $4,496 | $366,784 | $141,647 | $225,137 |
| 2021 | $4,476 | $359,593 | $138,870 | $220,723 |
| 2019 | $4,325 | $348,929 | $134,752 | $214,177 |
| 2018 | $4,231 | $342,088 | $132,110 | $209,978 |
| 2016 | $4,005 | $328,806 | $126,981 | $201,825 |
| 2015 | $3,941 | $323,868 | $125,074 | $198,794 |
| 2014 | $3,902 | $317,524 | $122,624 | $194,900 |
Source: Public Records
Map
Nearby Homes
- 26065 Redbluff Dr
- 26320 W Plata Ln
- 26144 Kenrose Cir
- 26353 W Plata Ln
- 26134 Roymor Dr
- 26322 W Bravo Ln
- 26304 W Bravo Ln
- 5510 Las Virgenes Rd
- 5534 Las Virgenes Rd Unit 120
- 26106 Veva Way
- 5602 Las Virgenes Rd Unit 79
- 26004 Adamor Rd
- 5622 Las Virgenes Rd Unit 12
- 26261 Veva Way
- 26120 Adamor Rd
- 5839 Parkmor Rd
- 26004 Trana Cir
- 4622 Cielo Cir
- 4591 Camino Del Sol
- 5964 Ruthwood Dr
- 5330 Parkmor Rd
- 5332 Parkmor Rd
- 26078 Redbluff Dr
- 5341 Parkmor Rd
- 5320 Las Virgenes Rd
- 5350 Parkmor Rd
- 26070 Redbluff Dr
- 5356 Parkmor Rd
- 5357 Parkmor Rd
- 5360 Parkmor Rd
- 5361 Parkmor Rd
- 26062 Redbluff Dr
- 5340 Las Virgenes Rd Unit 24
- 5340 Las Virgenes Rd Unit 23
- 5340 Las Virgenes Rd Unit 22
- 5340 Las Virgenes Rd Unit 21
- 5340 Las Virgenes Rd Unit 19
- 5340 Las Virgenes Rd Unit 18
- 5340 Las Virgenes Rd Unit 17
- 5340 Las Virgenes Rd Unit 16