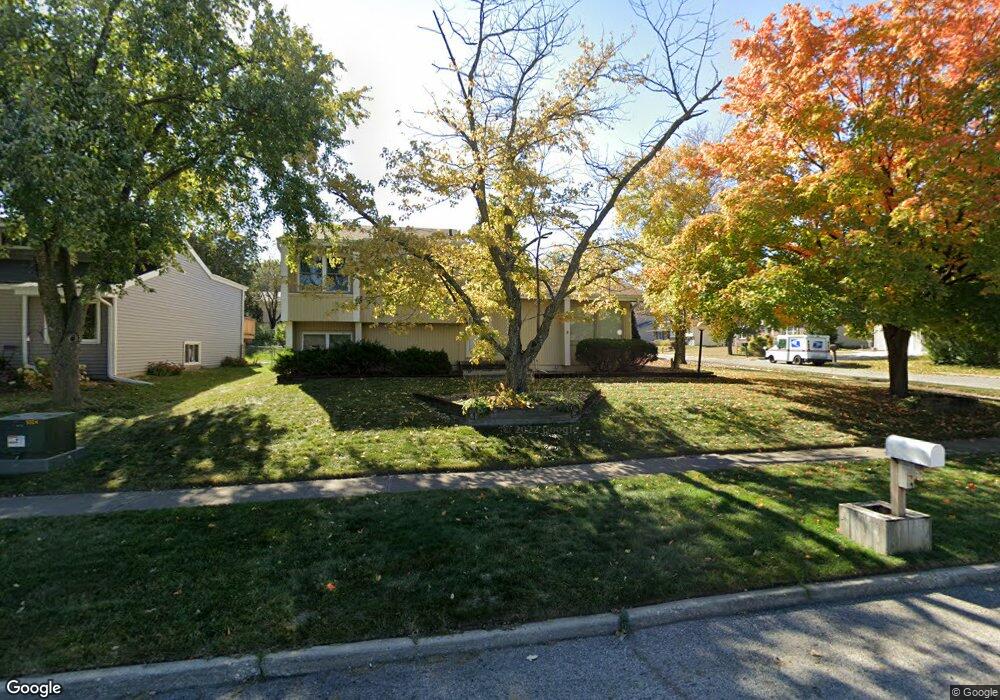
5324 Twana Dr Des Moines, IA 50310
Meredith NeighborhoodEstimated Value: $255,000 - $300,000
--
Bed
2
Baths
1,088
Sq Ft
$252/Sq Ft
Est. Value
About This Home
This home is located at 5324 Twana Dr, Des Moines, IA 50310 and is currently estimated at $274,417, approximately $252 per square foot. 5324 Twana Dr is a home located in Polk County with nearby schools including Lawson Elementary School, Johnston Middle School, and Summit Middle School.
Ownership History
Date
Name
Owned For
Owner Type
Purchase Details
Closed on
Nov 24, 2015
Sold by
Moore Cheryl A
Bought by
Moore Roger E
Current Estimated Value
Purchase Details
Closed on
Mar 10, 1997
Sold by
Layman Stephen Ray and Layman Elizabeth G
Bought by
Moore Roger E and Moore Cheryl A
Home Financials for this Owner
Home Financials are based on the most recent Mortgage that was taken out on this home.
Original Mortgage
$88,000
Interest Rate
7.95%
Create a Home Valuation Report for This Property
The Home Valuation Report is an in-depth analysis detailing your home's value as well as a comparison with similar homes in the area
Home Values in the Area
Average Home Value in this Area
Purchase History
| Date | Buyer | Sale Price | Title Company |
|---|---|---|---|
| Moore Roger E | -- | None Available | |
| Moore Roger E | $109,500 | -- |
Source: Public Records
Mortgage History
| Date | Status | Borrower | Loan Amount |
|---|---|---|---|
| Previous Owner | Moore Roger E | $88,000 |
Source: Public Records
Tax History Compared to Growth
Tax History
| Year | Tax Paid | Tax Assessment Tax Assessment Total Assessment is a certain percentage of the fair market value that is determined by local assessors to be the total taxable value of land and additions on the property. | Land | Improvement |
|---|---|---|---|---|
| 2025 | $4,680 | $288,400 | $54,800 | $233,600 |
| 2024 | $4,680 | $252,900 | $47,500 | $205,400 |
| 2023 | $4,698 | $252,900 | $47,500 | $205,400 |
| 2022 | $5,178 | $218,700 | $42,300 | $176,400 |
| 2021 | $5,038 | $218,700 | $42,300 | $176,400 |
| 2020 | $4,942 | $203,000 | $39,500 | $163,500 |
| 2019 | $4,570 | $203,000 | $39,500 | $163,500 |
| 2018 | $4,520 | $179,500 | $34,600 | $144,900 |
| 2017 | $4,224 | $179,500 | $34,600 | $144,900 |
| 2016 | $4,118 | $165,500 | $31,500 | $134,000 |
| 2015 | $4,118 | $165,500 | $31,500 | $134,000 |
| 2014 | $4,000 | $159,500 | $30,100 | $129,400 |
Source: Public Records
Map
Nearby Homes