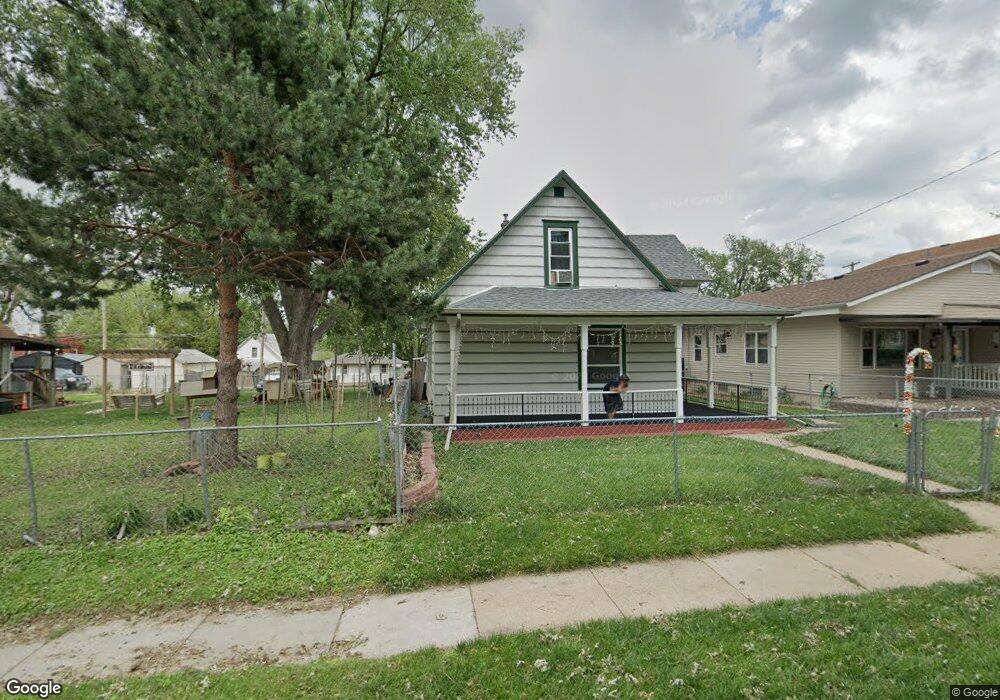
5325 S 33rd St Omaha, NE 68107
South Central Omaha NeighborhoodEstimated Value: $196,000 - $228,000
5
Beds
1
Bath
1,382
Sq Ft
$152/Sq Ft
Est. Value
About This Home
This home is located at 5325 S 33rd St, Omaha, NE 68107 and is currently estimated at $209,615, approximately $151 per square foot. 5325 S 33rd St is a home located in Douglas County with nearby schools including Indian Hill Elementary School, Sts. Peter and Paul School, and Assumption-Guadalupe School.
Ownership History
Date
Name
Owned For
Owner Type
Purchase Details
Closed on
Nov 28, 2023
Sold by
Serrano-Tavera Jose Luis and Serrano-Tavera Noemi Laurel
Bought by
Serrano Lilia T and Serrano Dionicio Villagomez
Current Estimated Value
Purchase Details
Closed on
Oct 17, 2009
Sold by
Palacios Pio and Saltero Estela
Bought by
Serrano Tavera Jose Luis
Home Financials for this Owner
Home Financials are based on the most recent Mortgage that was taken out on this home.
Original Mortgage
$63,822
Interest Rate
5.01%
Mortgage Type
FHA
Create a Home Valuation Report for This Property
The Home Valuation Report is an in-depth analysis detailing your home's value as well as a comparison with similar homes in the area
Home Values in the Area
Average Home Value in this Area
Purchase History
| Date | Buyer | Sale Price | Title Company |
|---|---|---|---|
| Serrano Lilia T | $65,000 | Dri Title & Escrow | |
| Serrano Tavera Jose Luis | $65,000 | Dri Title & Escrow |
Source: Public Records
Mortgage History
| Date | Status | Borrower | Loan Amount |
|---|---|---|---|
| Previous Owner | Serrano Tavera Jose Luis | $63,822 |
Source: Public Records
Tax History Compared to Growth
Tax History
| Year | Tax Paid | Tax Assessment Tax Assessment Total Assessment is a certain percentage of the fair market value that is determined by local assessors to be the total taxable value of land and additions on the property. | Land | Improvement |
|---|---|---|---|---|
| 2024 | $3,606 | $170,900 | $9,000 | $161,900 |
| 2023 | $3,606 | $170,900 | $9,000 | $161,900 |
| 2022 | $2,483 | $116,300 | $6,000 | $110,300 |
| 2021 | $2,462 | $116,300 | $6,000 | $110,300 |
| 2020 | $1,514 | $70,700 | $6,000 | $64,700 |
| 2019 | $2,122 | $98,800 | $6,000 | $92,800 |
| 2018 | $1,787 | $83,100 | $6,000 | $77,100 |
| 2017 | $1,368 | $63,300 | $4,400 | $58,900 |
| 2016 | $1,358 | $63,300 | $4,400 | $58,900 |
| 2015 | $1,340 | $63,300 | $4,400 | $58,900 |
| 2014 | $1,340 | $63,300 | $4,400 | $58,900 |
Source: Public Records
Map
Nearby Homes