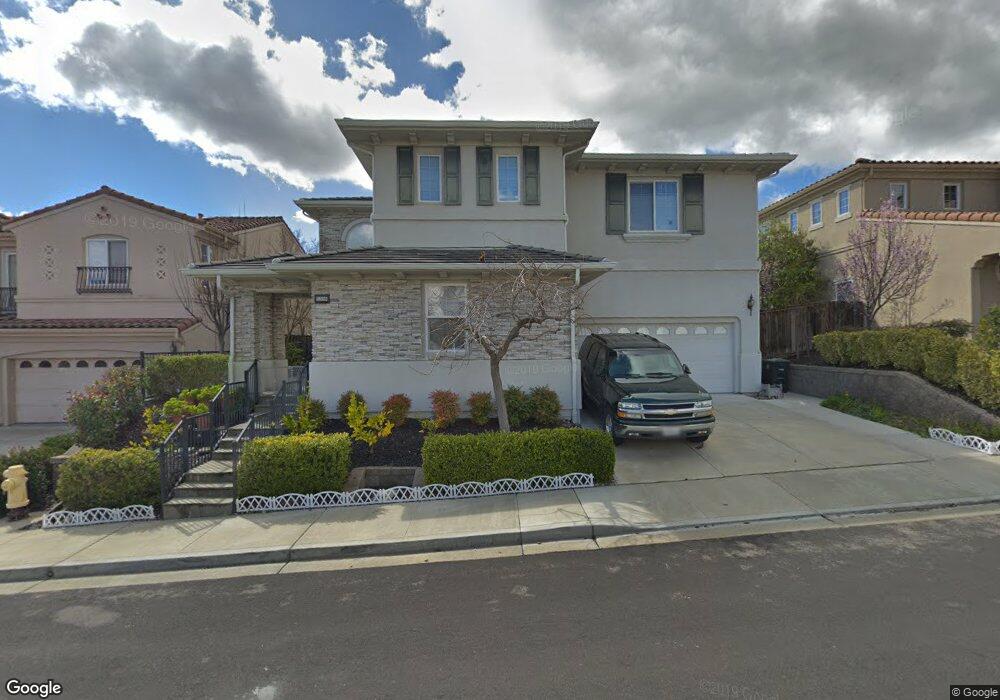
5328 Hazel Tine Ln Dublin, CA 94568
Dublin Ranch NeighborhoodEstimated Value: $2,257,000 - $2,812,000
4
Beds
4
Baths
3,920
Sq Ft
$635/Sq Ft
Est. Value
About This Home
This home is located at 5328 Hazel Tine Ln, Dublin, CA 94568 and is currently estimated at $2,487,943, approximately $634 per square foot. 5328 Hazel Tine Ln is a home located in Alameda County with nearby schools including J.M. Amador Elementary School, Dublin High School, and The Quarry Lane School.
Ownership History
Date
Name
Owned For
Owner Type
Purchase Details
Closed on
Dec 27, 2021
Sold by
Lue Chin Barry and Lue Nancy M
Bought by
Lue Chin Barry
Current Estimated Value
Home Financials for this Owner
Home Financials are based on the most recent Mortgage that was taken out on this home.
Original Mortgage
$1,250,000
Outstanding Balance
$1,150,363
Interest Rate
3%
Mortgage Type
New Conventional
Estimated Equity
$1,337,580
Purchase Details
Closed on
Aug 13, 2010
Sold by
Lue Chin Barry and Lue Barry C
Bought by
Lue Chin Barry and Lue Nancy M
Home Financials for this Owner
Home Financials are based on the most recent Mortgage that was taken out on this home.
Original Mortgage
$591,500
Interest Rate
3.87%
Mortgage Type
New Conventional
Purchase Details
Closed on
Oct 22, 2004
Sold by
Toll Ca Ii Lp
Bought by
Lue Barry C and Lue Nancey M
Home Financials for this Owner
Home Financials are based on the most recent Mortgage that was taken out on this home.
Original Mortgage
$650,000
Interest Rate
5%
Mortgage Type
Purchase Money Mortgage
Create a Home Valuation Report for This Property
The Home Valuation Report is an in-depth analysis detailing your home's value as well as a comparison with similar homes in the area
Home Values in the Area
Average Home Value in this Area
Purchase History
| Date | Buyer | Sale Price | Title Company |
|---|---|---|---|
| Lue Chin Barry | -- | Members Title Company | |
| Lue Chin Barry | -- | None Available | |
| Lue Barry C | $981,500 | Chicago Title Co |
Source: Public Records
Mortgage History
| Date | Status | Borrower | Loan Amount |
|---|---|---|---|
| Open | Lue Chin Barry | $1,250,000 | |
| Previous Owner | Lue Chin Barry | $591,500 | |
| Previous Owner | Lue Barry C | $650,000 |
Source: Public Records
Tax History Compared to Growth
Tax History
| Year | Tax Paid | Tax Assessment Tax Assessment Total Assessment is a certain percentage of the fair market value that is determined by local assessors to be the total taxable value of land and additions on the property. | Land | Improvement |
|---|---|---|---|---|
| 2025 | $17,859 | $1,360,854 | $410,328 | $957,526 |
| 2024 | $17,859 | $1,334,043 | $402,285 | $938,758 |
| 2023 | $17,673 | $1,314,751 | $394,398 | $920,353 |
| 2022 | $17,462 | $1,281,979 | $386,667 | $902,312 |
| 2021 | $17,314 | $1,256,709 | $379,087 | $884,622 |
| 2020 | $16,202 | $1,250,755 | $375,201 | $875,554 |
| 2019 | $16,225 | $1,226,238 | $367,846 | $858,392 |
| 2018 | $15,852 | $1,202,205 | $360,637 | $841,568 |
| 2017 | $15,648 | $1,178,641 | $353,568 | $825,073 |
| 2016 | $14,264 | $1,155,539 | $346,638 | $808,901 |
| 2015 | $13,752 | $1,138,188 | $341,433 | $796,755 |
| 2014 | $12,938 | $1,044,000 | $313,200 | $730,800 |
Source: Public Records
Map
Nearby Homes
- 2848 E Cog Hill Terrace
- 4986 Grayhawk Ct
- 2528 Amantea Way
- 6010 Turnberry Dr
- 6013 Kingsmill Terrace
- 2371 Capistrello St
- 3005 Vittoria Loop
- 3105 Vittoria Loop
- 3135 Vittoria Loop
- 5636 N Dublin Ranch Dr
- 3956 Jordan Ranch Dr
- 3970 Jordan Ranch Dr
- 4456 Sunset View Dr
- 3493 Capoterra Way
- 4369 Table Mountain Rd
- 2378 Carbondale Way
- 4439 Sunset View Dr
- 2336 Carbondale Way
- 3391 Monaghan St
- 4287 Loyalton Rd
- 5316 Hazel Tine Ln
- 5332 Hazel Tine Ln
- 5385 Blair More Place
- 5385 Blairmore Place
- 5367 Blair More Place
- 5310 Hazel Tine Ln
- 5325 Hazel Tine Ln
- 5338 Hazel Tine Ln
- 5399 Blair More Place
- 5333 Hazel Tine Ln
- 5355 Blair More Place
- 5317 Hazel Tine Ln
- 5376 Hazel Tine Ln
- 5339 Hazel Tine Ln
- 5309 Hazel Tine Ln
- 5302 Hazel Tine Ln
- 5337 Blair More Place
- 5398 Blair More Place
- 5372 Signal Hill Dr
- 5380 Hazel Tine Ln