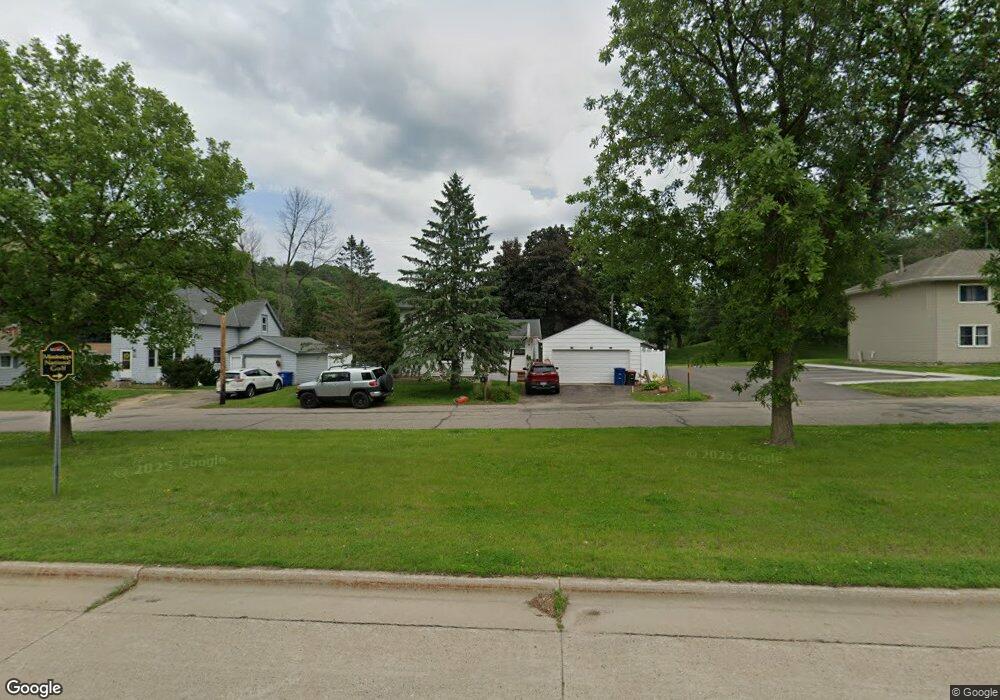
533 21st St Red Wing, MN 55066
Estimated Value: $208,000 - $252,000
3
Beds
2
Baths
1,824
Sq Ft
$126/Sq Ft
Est. Value
About This Home
This home is located at 533 21st St, Red Wing, MN 55066 and is currently estimated at $229,356, approximately $125 per square foot. 533 21st St is a home located in Goodhue County with nearby schools including Sunnyside Elementary School, Burnside Elementary School, and Twin Bluff Middle School.
Ownership History
Date
Name
Owned For
Owner Type
Purchase Details
Closed on
Jul 24, 2020
Sold by
Jonas Bradley E and Jonas Annette M
Bought by
Parra Alfredo Figueroa and Fernandez Mejia Sandy
Current Estimated Value
Home Financials for this Owner
Home Financials are based on the most recent Mortgage that was taken out on this home.
Original Mortgage
$170,652
Outstanding Balance
$151,323
Interest Rate
3.1%
Mortgage Type
FHA
Estimated Equity
$78,033
Purchase Details
Closed on
Jun 17, 2003
Sold by
Jonas Olga E
Bought by
Jonas Bradley E and Jonas Annette M
Create a Home Valuation Report for This Property
The Home Valuation Report is an in-depth analysis detailing your home's value as well as a comparison with similar homes in the area
Home Values in the Area
Average Home Value in this Area
Purchase History
| Date | Buyer | Sale Price | Title Company |
|---|---|---|---|
| Parra Alfredo Figueroa | $173,800 | Knight Barry Ttl United Llc | |
| Jonas Bradley E | $77,000 | -- |
Source: Public Records
Mortgage History
| Date | Status | Borrower | Loan Amount |
|---|---|---|---|
| Open | Parra Alfredo Figueroa | $170,652 |
Source: Public Records
Tax History Compared to Growth
Tax History
| Year | Tax Paid | Tax Assessment Tax Assessment Total Assessment is a certain percentage of the fair market value that is determined by local assessors to be the total taxable value of land and additions on the property. | Land | Improvement |
|---|---|---|---|---|
| 2025 | $1,662 | $153,600 | $36,200 | $117,400 |
| 2024 | $1,662 | $151,300 | $36,200 | $115,100 |
| 2023 | $1,724 | $144,000 | $36,400 | $107,600 |
| 2022 | $1,532 | $143,200 | $36,400 | $106,800 |
| 2021 | $1,414 | $124,400 | $36,400 | $88,000 |
| 2020 | $1,318 | $117,900 | $36,400 | $81,500 |
| 2019 | $1,288 | $106,000 | $36,400 | $69,600 |
| 2018 | $1,010 | $105,200 | $35,000 | $70,200 |
| 2017 | $988 | $94,000 | $35,000 | $59,000 |
| 2016 | $902 | $93,300 | $35,000 | $58,300 |
| 2015 | $868 | $90,700 | $35,000 | $55,700 |
| 2014 | -- | $87,700 | $35,000 | $52,700 |
Source: Public Records
Map
Nearby Homes