Estimated Value: $190,000 - $246,750
3
Beds
3
Baths
1,512
Sq Ft
$152/Sq Ft
Est. Value
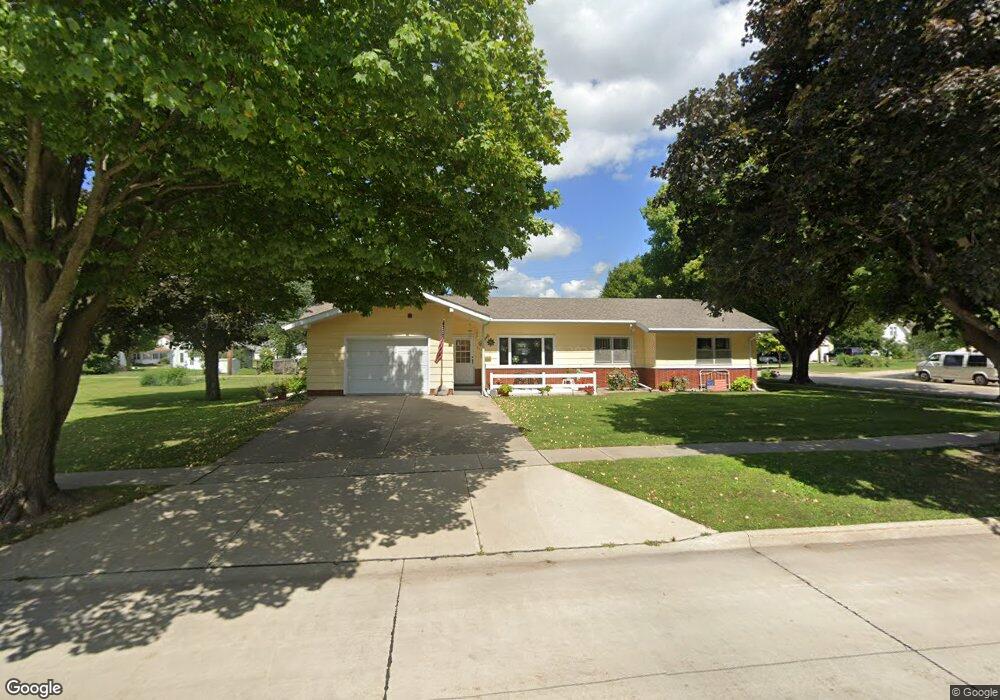
About This Home
This home is located at 533 Chestnut St, Osage, IA 50461 and is currently estimated at $229,688, approximately $151 per square foot. 533 Chestnut St is a home located in Mitchell County with nearby schools including Lincoln Elementary School, Osage Middle School, and Osage High School.
Ownership History
Date
Name
Owned For
Owner Type
Purchase Details
Closed on
Jun 21, 2022
Sold by
Flugge Tanner R
Bought by
Homeward Inc
Current Estimated Value
Home Financials for this Owner
Home Financials are based on the most recent Mortgage that was taken out on this home.
Original Mortgage
$0
Interest Rate
5.3%
Mortgage Type
New Conventional
Purchase Details
Closed on
Apr 28, 2016
Sold by
Rogers Gerald D
Bought by
Rogers Gerald D and Rogers Family Trust
Purchase Details
Closed on
May 6, 2005
Sold by
Decklever Lavern M and Decklever Richard
Bought by
Clark Karon
Purchase Details
Closed on
May 4, 2005
Sold by
Decklerver Lavern M and Decklever Richrad
Bought by
Clark Karou
Create a Home Valuation Report for This Property
The Home Valuation Report is an in-depth analysis detailing your home's value as well as a comparison with similar homes in the area
Home Values in the Area
Average Home Value in this Area
Purchase History
| Date | Buyer | Sale Price | Title Company |
|---|---|---|---|
| Homeward Inc | $4,000 | None Listed On Document | |
| Rogers Gerald D | -- | None Available | |
| Clark Karon | -- | None Available | |
| Clark Karou | $130,000 | None Available |
Source: Public Records
Mortgage History
| Date | Status | Borrower | Loan Amount |
|---|---|---|---|
| Closed | Homeward Inc | $0 |
Source: Public Records
Tax History
| Year | Tax Paid | Tax Assessment Tax Assessment Total Assessment is a certain percentage of the fair market value that is determined by local assessors to be the total taxable value of land and additions on the property. | Land | Improvement |
|---|---|---|---|---|
| 2025 | $3,496 | $248,180 | $17,100 | $231,080 |
| 2024 | $3,496 | $234,240 | $17,100 | $217,140 |
| 2023 | $2,886 | $202,100 | $17,100 | $185,000 |
| 2022 | $2,504 | $145,820 | $17,100 | $128,720 |
| 2021 | $2,504 | $145,820 | $17,100 | $128,720 |
| 2020 | $2,592 | $136,490 | $17,100 | $119,390 |
Source: Public Records
Map
Nearby Homes
Your Personal Tour Guide
Ask me questions while you tour the home.