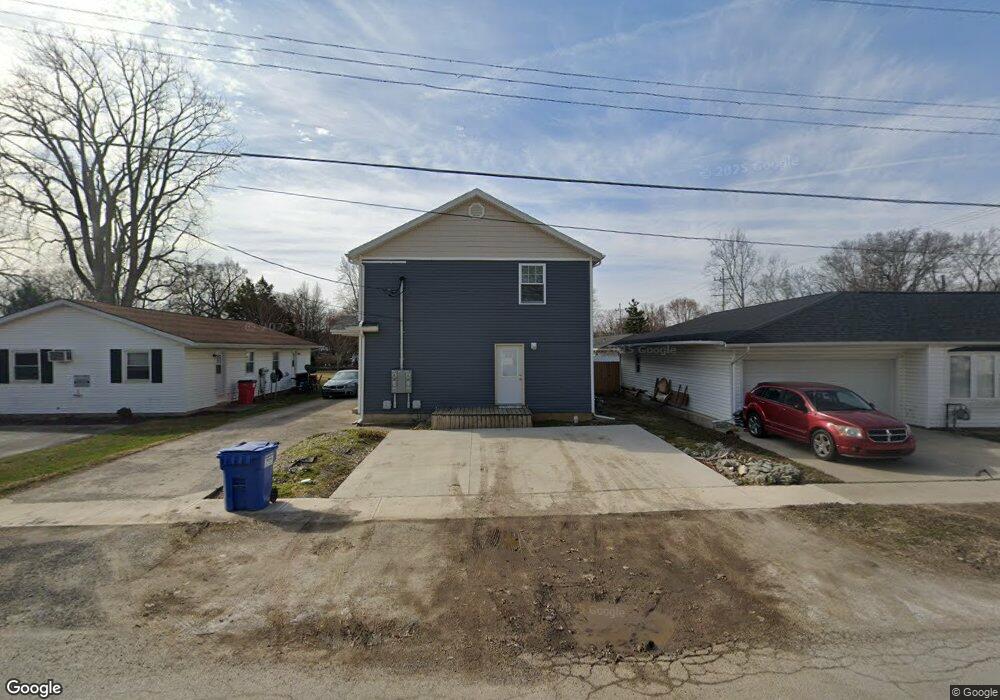
533 Davis St Findlay, OH 45840
Estimated Value: $324,499
8
Beds
2
Baths
2,700
Sq Ft
$120/Sq Ft
Est. Value
About This Home
This home is located at 533 Davis St, Findlay, OH 45840 and is currently priced at $324,499, approximately $120 per square foot. 533 Davis St is a home located in Hancock County with nearby schools including Northview Elementary School, Bigelow Hill Elementary School, and Glenwood Middle School.
Create a Home Valuation Report for This Property
The Home Valuation Report is an in-depth analysis detailing your home's value as well as a comparison with similar homes in the area
Home Values in the Area
Average Home Value in this Area
Tax History
| Year | Tax Paid | Tax Assessment Tax Assessment Total Assessment is a certain percentage of the fair market value that is determined by local assessors to be the total taxable value of land and additions on the property. | Land | Improvement |
|---|---|---|---|---|
| 2024 | $1,167 | $32,020 | $5,460 | $26,560 |
| 2023 | $1,169 | $32,020 | $5,460 | $26,560 |
| 2022 | $1,165 | $32,020 | $5,460 | $26,560 |
| 2021 | $1,270 | $30,410 | $5,450 | $24,960 |
| 2020 | $1,138 | $27,240 | $5,450 | $21,790 |
| 2019 | $1,115 | $27,240 | $5,450 | $21,790 |
| 2018 | $1,073 | $24,040 | $4,740 | $19,300 |
| 2017 | $1,073 | $24,040 | $4,740 | $19,300 |
| 2016 | $1,069 | $24,040 | $4,740 | $19,300 |
| 2015 | $1,177 | $26,170 | $4,740 | $21,430 |
| 2014 | $1,177 | $26,170 | $4,740 | $21,430 |
| 2012 | $1,186 | $26,170 | $4,740 | $21,430 |
Source: Public Records
Map
Nearby Homes
- 605 Davis St
- 705 Swing Ave
- 719 Davis St
- 1005 Broad Ave
- 341 Defiance Ave
- 421 Clifton Ave
- 528 Rector Ave
- 140 Monroe Ave
- 146 Clifton Ave
- 206 Midland Ave
- 217 Prentiss Ave
- 207 Ash Ave
- 239 Edith Ave
- 724 Edith Ave
- 301 Allen Ave
- 701 W Melrose Ave
- 315 W Melrose Ave
- 322 Midland Ave
- 925 W Melrose Ave
- 125 Cherry St
Your Personal Tour Guide
Ask me questions while you tour the home.