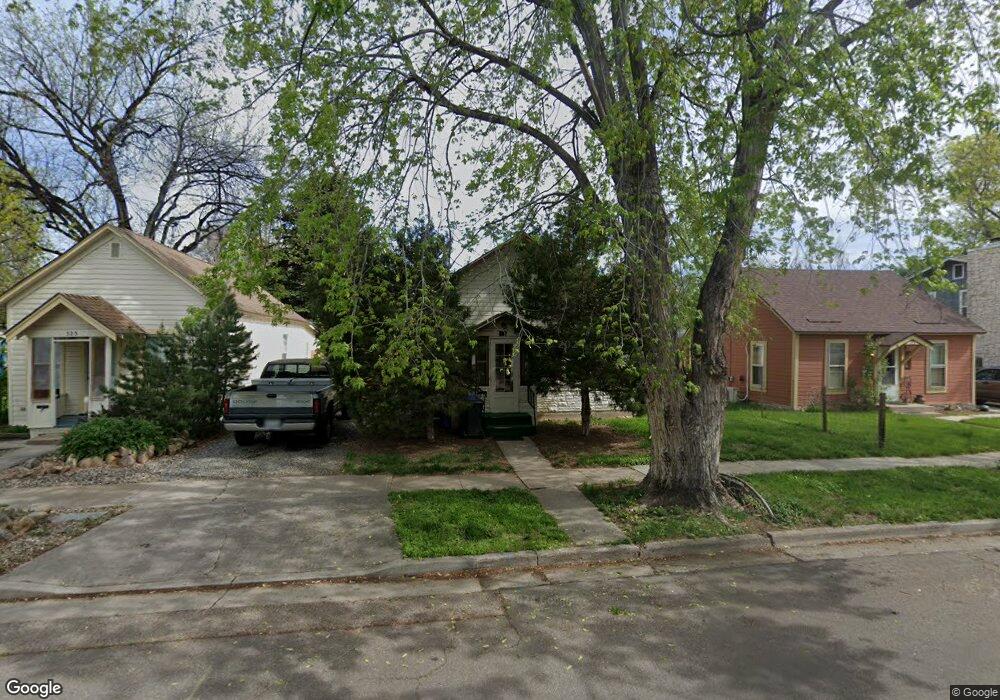
533 E 11th St Loveland, CO 80537
Estimated Value: $299,000 - $358,000
2
Beds
1
Bath
768
Sq Ft
$412/Sq Ft
Est. Value
About This Home
This home is located at 533 E 11th St, Loveland, CO 80537 and is currently estimated at $316,434, approximately $412 per square foot. 533 E 11th St is a home located in Larimer County with nearby schools including Truscott Elementary School, Bill Reed Middle School, and Loveland High School.
Ownership History
Date
Name
Owned For
Owner Type
Purchase Details
Closed on
Dec 13, 2020
Sold by
Miklara Properties Llc
Bought by
Colorado Affluent Real Estate Llc
Current Estimated Value
Home Financials for this Owner
Home Financials are based on the most recent Mortgage that was taken out on this home.
Original Mortgage
$168,000
Interest Rate
2.67%
Mortgage Type
Construction
Purchase Details
Closed on
Feb 10, 2017
Sold by
Orner Martin E and Morris Pamela S
Bought by
Miklara Properties Llc
Purchase Details
Closed on
Sep 21, 2015
Sold by
Milara Properties Llc
Bought by
Martin E Orner Trust
Purchase Details
Closed on
Jun 23, 2015
Sold by
Orner Martin E and Morris Pamela S
Bought by
Miklara Properties Llc
Purchase Details
Closed on
Mar 26, 2013
Sold by
Orner Martin Evan
Bought by
Martin E Orner Trust
Purchase Details
Closed on
Nov 1, 1993
Sold by
Vanbeber Clarence E
Bought by
Orner Martin Evan
Create a Home Valuation Report for This Property
The Home Valuation Report is an in-depth analysis detailing your home's value as well as a comparison with similar homes in the area
Home Values in the Area
Average Home Value in this Area
Purchase History
| Date | Buyer | Sale Price | Title Company |
|---|---|---|---|
| Colorado Affluent Real Estate Llc | $210,000 | First American Title | |
| Miklara Properties Llc | -- | None Available | |
| Martin E Orner Trust | -- | None Available | |
| Miklara Properties Llc | -- | None Available | |
| Martin E Orner Trust | -- | None Available | |
| Orner Martin Evan | $48,000 | -- |
Source: Public Records
Mortgage History
| Date | Status | Borrower | Loan Amount |
|---|---|---|---|
| Previous Owner | Colorado Affluent Real Estate Llc | $168,000 |
Source: Public Records
Tax History Compared to Growth
Tax History
| Year | Tax Paid | Tax Assessment Tax Assessment Total Assessment is a certain percentage of the fair market value that is determined by local assessors to be the total taxable value of land and additions on the property. | Land | Improvement |
|---|---|---|---|---|
| 2025 | $1,561 | $23,249 | $2,546 | $20,703 |
| 2024 | $1,506 | $23,249 | $2,546 | $20,703 |
| 2022 | $1,368 | $17,187 | $2,641 | $14,546 |
| 2021 | $1,405 | $17,682 | $2,717 | $14,965 |
| 2020 | $877 | $11,032 | $2,717 | $8,315 |
| 2019 | $862 | $11,032 | $2,717 | $8,315 |
| 2018 | $756 | $9,187 | $2,736 | $6,451 |
| 2017 | $651 | $9,187 | $2,736 | $6,451 |
| 2016 | $548 | $7,467 | $3,025 | $4,442 |
| 2015 | $543 | $7,460 | $3,020 | $4,440 |
| 2014 | -- | $6,260 | $3,020 | $3,240 |
Source: Public Records
Map
Nearby Homes
- 411 E 10th St
- 526 E 13th St
- 1312 N Washington Ave
- 1204 N Lincoln Ave
- 1031 N Lincoln Ave
- 1034 N Cleveland Ave
- 717 E 8th St
- 707 E 8th St
- 1117 Cleveland Ave
- 770 N Lincoln Ave
- 103 E 12th St
- 853 E 7th St
- 0 W Eisenhower Blvd
- 1550 N Jefferson Ave
- 1336 Arthur Ave
- 535 N Adams Ave
- 125 E 15th St
- 205 E 6th St Unit 400
- 205 E 6th St Unit 302
- 205 E 6th St Unit 200
- 523 E 11th St
- 543 E 11th St
- 513 E 11th St
- 1103 Highland Dr
- 507 E 11th St
- 551 E 11th St
- 1102 Highland Dr
- 1102 Washington Ave
- 1105 Highland Dr
- 532 E 11th St
- 540 E 11th St
- 520 E 11th St
- 601 E 11th St
- 1106 Washington Ave
- 544 E 11th St
- 510 E 11th St
- 1110 Highland Dr
- 550 E 11th St
- 504 E 11th St
- 445 E 11th St