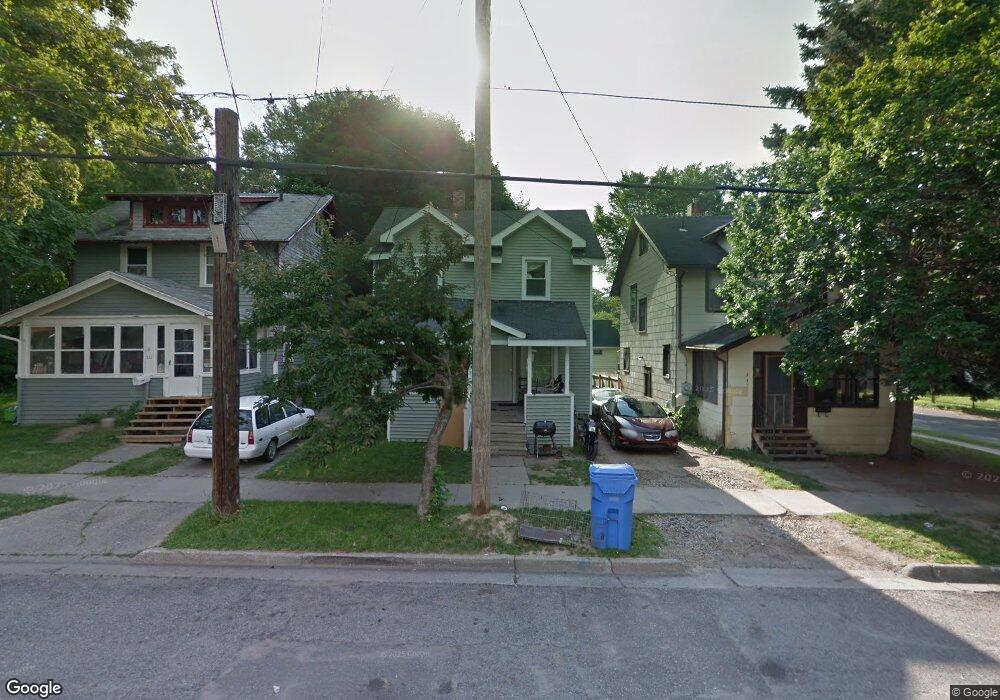
533 Lathrop St Lansing, MI 48912
Hunter Park NeighborhoodEstimated Value: $87,354 - $111,000
--
Bed
--
Bath
1,056
Sq Ft
$91/Sq Ft
Est. Value
About This Home
This home is located at 533 Lathrop St, Lansing, MI 48912 and is currently estimated at $96,089, approximately $90 per square foot. 533 Lathrop St is a home located in Ingham County with nearby schools including Pattengill Academy, Riddle Elementary School, and Eastern High School.
Ownership History
Date
Name
Owned For
Owner Type
Purchase Details
Closed on
Dec 17, 2012
Sold by
Garno Christopher K and Garno Michael
Bought by
Garno Michael and Garno Trisha
Current Estimated Value
Purchase Details
Closed on
Jul 28, 2006
Sold by
Garno Christopher K and Garno Michael J
Bought by
Garno Christopher K and Garno Michael J
Purchase Details
Closed on
Jul 7, 2006
Sold by
Garno Christopher K
Bought by
Garno Christopher K and Garno Michael J
Purchase Details
Closed on
Jun 30, 2005
Sold by
Mortgage Electronic Registration Systems
Bought by
Jpmorgan Chase Bank Na
Purchase Details
Closed on
Jun 23, 2005
Sold by
Wright Mark A
Bought by
Mortgage Electronic Registration Systems
Purchase Details
Closed on
Feb 6, 2004
Sold by
Gupta Amar N and Ackerman Joell
Bought by
Wright Mark A
Home Financials for this Owner
Home Financials are based on the most recent Mortgage that was taken out on this home.
Original Mortgage
$66,500
Interest Rate
9.27%
Mortgage Type
Purchase Money Mortgage
Create a Home Valuation Report for This Property
The Home Valuation Report is an in-depth analysis detailing your home's value as well as a comparison with similar homes in the area
Home Values in the Area
Average Home Value in this Area
Purchase History
| Date | Buyer | Sale Price | Title Company |
|---|---|---|---|
| Garno Michael | -- | None Available | |
| Garno Christopher K | -- | Capitol City Title Agency Ll | |
| Garno Christopher K | -- | Capitol City Title Agency | |
| Jpmorgan Chase Bank Na | -- | -- | |
| Mortgage Electronic Registration Systems | $52,000 | -- | |
| Wright Mark A | $70,000 | Michigan Title Company |
Source: Public Records
Mortgage History
| Date | Status | Borrower | Loan Amount |
|---|---|---|---|
| Previous Owner | Wright Mark A | $66,500 |
Source: Public Records
Tax History Compared to Growth
Tax History
| Year | Tax Paid | Tax Assessment Tax Assessment Total Assessment is a certain percentage of the fair market value that is determined by local assessors to be the total taxable value of land and additions on the property. | Land | Improvement |
|---|---|---|---|---|
| 2025 | $1,987 | $47,000 | $2,900 | $44,100 |
| 2024 | $16 | $41,300 | $2,900 | $38,400 |
| 2023 | $1,871 | $33,700 | $2,900 | $30,800 |
| 2022 | $1,711 | $28,300 | $2,300 | $26,000 |
| 2021 | $1,672 | $26,200 | $2,600 | $23,600 |
| 2020 | $1,660 | $25,000 | $2,600 | $22,400 |
| 2019 | $1,602 | $21,100 | $2,600 | $18,500 |
| 2018 | $1,520 | $19,500 | $2,600 | $16,900 |
| 2017 | $1,463 | $19,500 | $2,600 | $16,900 |
| 2016 | $1,411 | $19,100 | $2,600 | $16,500 |
| 2015 | $1,411 | $18,500 | $5,277 | $13,223 |
| 2014 | $1,411 | $18,300 | $5,277 | $13,023 |
Source: Public Records
Map
Nearby Homes
- 523 Clifford St
- 607 Shepard St Unit 2
- 619 Shepard St
- 400 Lathrop St
- V/L E Kalamazoo St
- 424 S Clemens Ave
- 309 & 311 S Holmes St
- 515 S Clemens Ave
- 207 Allen St
- 910 S Holmes St
- 1019 Dakin St
- 637 S Clemens Ave
- 528 S Fairview Ave
- 1346 Eureka St
- 129 Clifford St
- 329 S Clemens Ave
- 1128 Hickory St
- 222 S Clemens Ave
- 701 S Fairview Ave
- 1212 Climax St