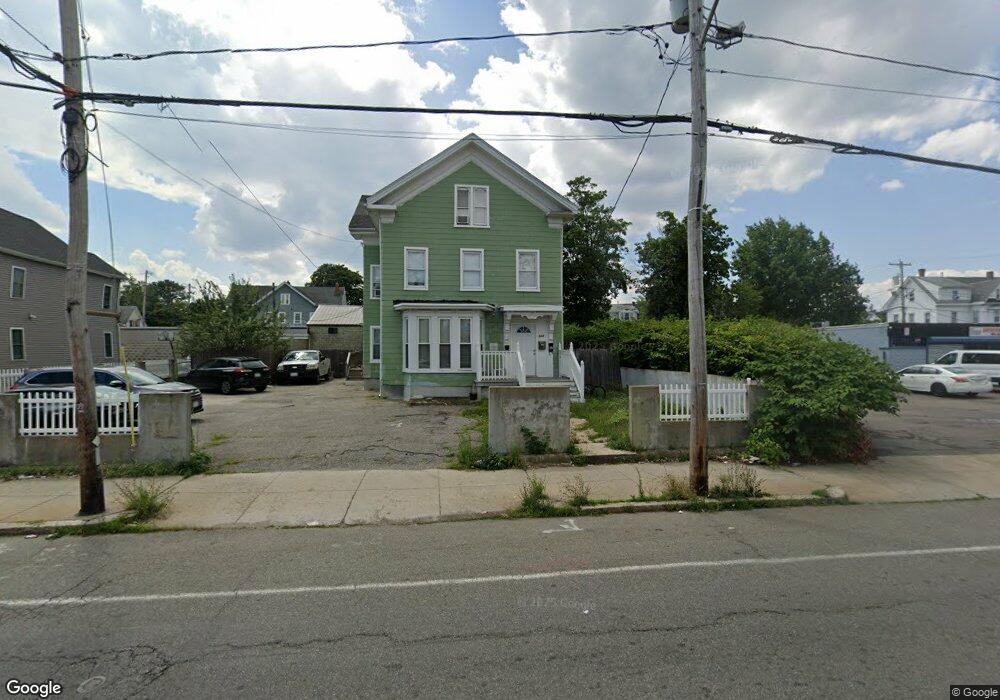
533 Main St Brockton, MA 02301
Clifton Heights NeighborhoodEstimated Value: $780,000 - $970,000
5
Beds
3
Baths
3,166
Sq Ft
$275/Sq Ft
Est. Value
About This Home
This home is located at 533 Main St, Brockton, MA 02301 and is currently estimated at $870,667, approximately $275 per square foot. 533 Main St is a home located in Plymouth County with nearby schools including Gilmore Elementary School, John F. Kennedy Elementary School, and Davis K-8 School.
Ownership History
Date
Name
Owned For
Owner Type
Purchase Details
Closed on
Mar 15, 2001
Sold by
Zigouras Thomas and Zigouras Nicholas J
Bought by
Andrade Maria J and Andrade Francisco R
Current Estimated Value
Home Financials for this Owner
Home Financials are based on the most recent Mortgage that was taken out on this home.
Original Mortgage
$140,200
Interest Rate
7.01%
Mortgage Type
Purchase Money Mortgage
Create a Home Valuation Report for This Property
The Home Valuation Report is an in-depth analysis detailing your home's value as well as a comparison with similar homes in the area
Home Values in the Area
Average Home Value in this Area
Purchase History
| Date | Buyer | Sale Price | Title Company |
|---|---|---|---|
| Andrade Maria J | $156,000 | -- |
Source: Public Records
Mortgage History
| Date | Status | Borrower | Loan Amount |
|---|---|---|---|
| Open | Andrade Maria J | $224,000 | |
| Closed | Andrade Maria J | $140,200 |
Source: Public Records
Tax History
| Year | Tax Paid | Tax Assessment Tax Assessment Total Assessment is a certain percentage of the fair market value that is determined by local assessors to be the total taxable value of land and additions on the property. | Land | Improvement |
|---|---|---|---|---|
| 2025 | $8,408 | $694,300 | $136,600 | $557,700 |
| 2024 | $8,040 | $668,900 | $136,600 | $532,300 |
| 2023 | $7,952 | $612,600 | $102,200 | $510,400 |
| 2022 | $7,249 | $518,900 | $92,700 | $426,200 |
| 2021 | $6,845 | $472,100 | $76,700 | $395,400 |
| 2020 | $6,148 | $405,800 | $72,200 | $333,600 |
| 2019 | $5,919 | $380,900 | $69,900 | $311,000 |
| 2018 | $5,582 | $347,600 | $69,900 | $277,700 |
| 2017 | $5,245 | $325,800 | $69,900 | $255,900 |
| 2016 | $3,297 | $189,900 | $67,700 | $122,200 |
| 2015 | $2,782 | $153,300 | $67,700 | $85,600 |
| 2014 | $2,720 | $150,000 | $67,700 | $82,300 |
Source: Public Records
Map
Nearby Homes
Your Personal Tour Guide
Ask me questions while you tour the home.