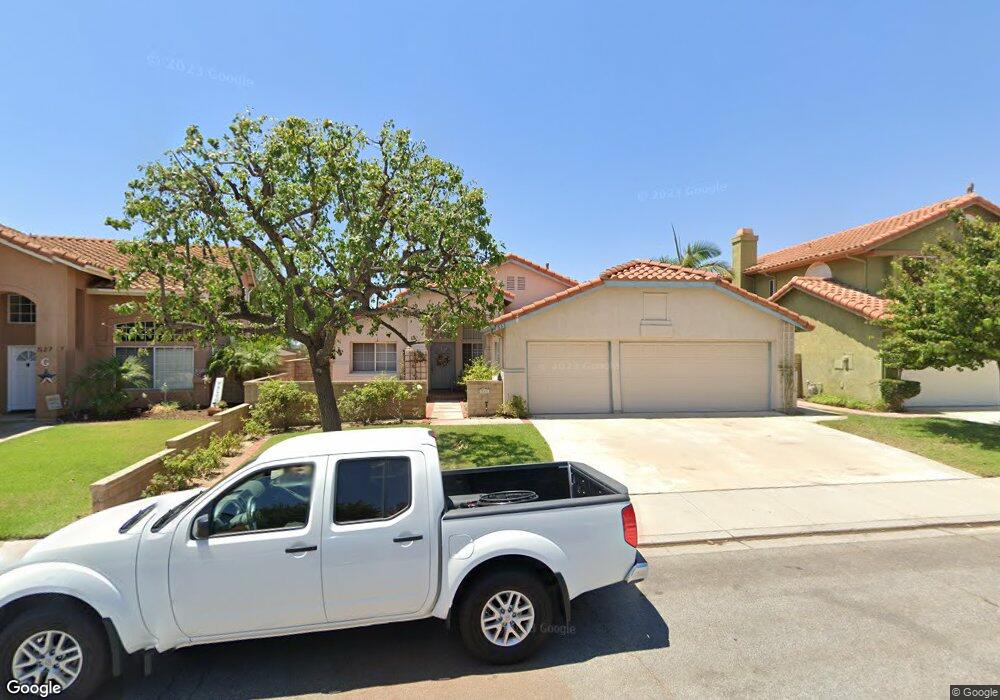
533 Mockingbird Ln Fillmore, CA 93015
Estimated Value: $734,000 - $753,000
4
Beds
2
Baths
1,893
Sq Ft
$393/Sq Ft
Est. Value
About This Home
This home is located at 533 Mockingbird Ln, Fillmore, CA 93015 and is currently estimated at $744,818, approximately $393 per square foot. 533 Mockingbird Ln is a home located in Ventura County with nearby schools including Mountain Vista and Fillmore Senior High.
Ownership History
Date
Name
Owned For
Owner Type
Purchase Details
Closed on
Jul 21, 2014
Sold by
Schaefle Wallace R and Schaefle Carolyn A
Bought by
Wallace R & Carolyn A Schaefle 2014 Trus and Schaefle Carolyn A
Current Estimated Value
Create a Home Valuation Report for This Property
The Home Valuation Report is an in-depth analysis detailing your home's value as well as a comparison with similar homes in the area
Home Values in the Area
Average Home Value in this Area
Purchase History
| Date | Buyer | Sale Price | Title Company |
|---|---|---|---|
| Wallace R & Carolyn A Schaefle 2014 Trus | -- | None Available |
Source: Public Records
Tax History
| Year | Tax Paid | Tax Assessment Tax Assessment Total Assessment is a certain percentage of the fair market value that is determined by local assessors to be the total taxable value of land and additions on the property. | Land | Improvement |
|---|---|---|---|---|
| 2025 | $4,007 | $336,474 | $134,588 | $201,886 |
| 2024 | $4,007 | $329,877 | $131,949 | $197,928 |
| 2023 | $3,976 | $323,409 | $129,361 | $194,048 |
| 2022 | $3,682 | $317,068 | $126,824 | $190,244 |
| 2021 | $4,115 | $310,851 | $124,337 | $186,514 |
| 2020 | $3,830 | $307,665 | $123,063 | $184,602 |
| 2019 | $3,830 | $301,633 | $120,650 | $180,983 |
| 2018 | $3,749 | $295,720 | $118,285 | $177,435 |
| 2017 | $3,758 | $289,922 | $115,966 | $173,956 |
| 2016 | $3,491 | $284,239 | $113,693 | $170,546 |
| 2015 | $3,392 | $279,971 | $111,986 | $167,985 |
| 2014 | $3,381 | $274,490 | $109,794 | $164,696 |
Source: Public Records
Map
Nearby Homes
- 1120 1st St
- 600 C St
- 1106 Mockingbird Ln
- 1112 Mockingbird Ln
- 320 D St
- 947 Meadowlark Dr
- 1163 W Ventura St
- 222 Village Square
- 202 Avon Ln
- 228 Parkhaven Ct
- 553 Grapefruit Ln
- 831 Blaine Ave
- 815 Woodgrove Rd
- 809 Woodgrove Rd
- 404 Central Ave
- 340 Central Ave
- 586 Apricot Ln
- 871 Oak Ave
- 578 Apricot Ln
- 1172 Oak Ave
- 527 Mockingbird Ln
- 539 Mockingbird Ln
- 521 Mockingbird Ln
- 545 Mockingbird Ln
- 532 Mockingbird Ln
- 542 Mockingbird Ln
- 526 Mockingbird Ln
- 551 Mockingbird Ln
- 515 Mockingbird Ln
- 548 Mockingbird Ln
- 557 Mockingbird Ln
- 1137 Oriole Cir
- 1136 Meadowlark Dr
- 509 Mockingbird Ln
- 563 Mockingbird Ln
- 1138 Oriole Cir
- 560 Mockingbird Ln
- 1131 Oriole Cir
- 1130 Meadowlark Dr
- 503 Mockingbird Ln
Your Personal Tour Guide
Ask me questions while you tour the home.