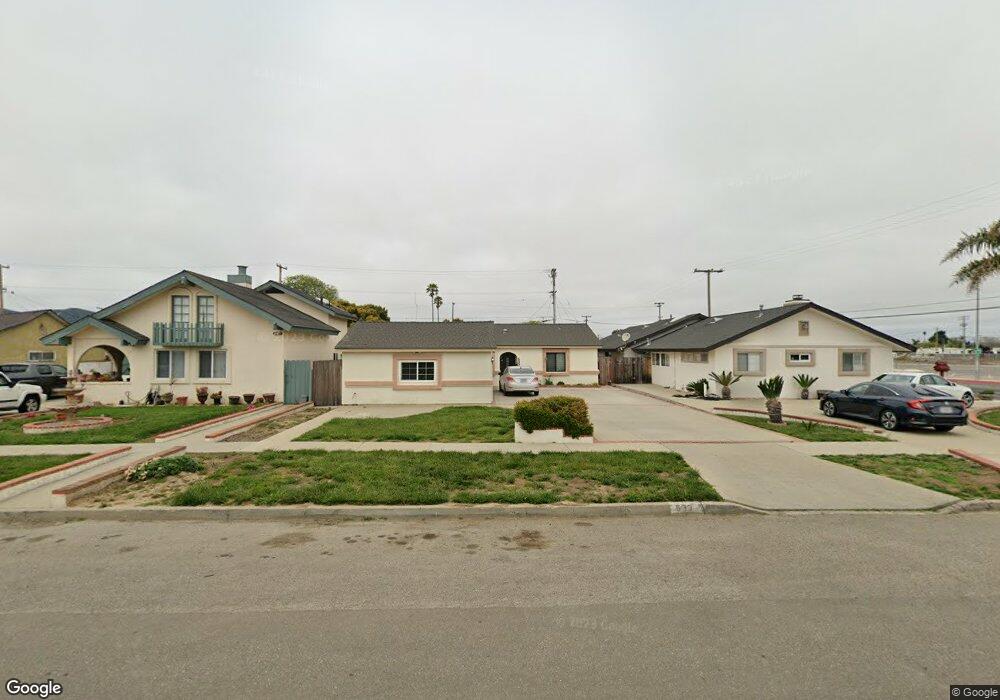
533 N N St Lompoc, CA 93436
Estimated Value: $507,000 - $612,000
4
Beds
2
Baths
1,336
Sq Ft
$414/Sq Ft
Est. Value
About This Home
This home is located at 533 N N St, Lompoc, CA 93436 and is currently estimated at $553,652, approximately $414 per square foot. 533 N N St is a home located in Santa Barbara County with nearby schools including La Canada Elementary School, Lompoc Valley Middle School, and Lompoc High School.
Ownership History
Date
Name
Owned For
Owner Type
Purchase Details
Closed on
Mar 25, 2019
Sold by
Rodriguez Ruben and De La Mora Rodriguez Norma Leticia
Bought by
Dickerson Demetrius D and Dickerson Tiffany N
Current Estimated Value
Home Financials for this Owner
Home Financials are based on the most recent Mortgage that was taken out on this home.
Original Mortgage
$366,715
Interest Rate
4%
Mortgage Type
VA
Purchase Details
Closed on
Dec 30, 2005
Sold by
Delgado Rafael and Delgado Claudia
Bought by
Rodriguez Ruben and Rodriguez Norma Leticia De La Mora
Home Financials for this Owner
Home Financials are based on the most recent Mortgage that was taken out on this home.
Original Mortgage
$70,000
Interest Rate
6.27%
Mortgage Type
Credit Line Revolving
Create a Home Valuation Report for This Property
The Home Valuation Report is an in-depth analysis detailing your home's value as well as a comparison with similar homes in the area
Home Values in the Area
Average Home Value in this Area
Purchase History
| Date | Buyer | Sale Price | Title Company |
|---|---|---|---|
| Dickerson Demetrius D | $355,000 | First American Title Company | |
| Rodriguez Ruben | $350,000 | First American Title Company |
Source: Public Records
Mortgage History
| Date | Status | Borrower | Loan Amount |
|---|---|---|---|
| Previous Owner | Dickerson Demetrius D | $366,715 | |
| Previous Owner | Rodriguez Ruben | $70,000 | |
| Previous Owner | Rodriguez Ruben | $280,000 |
Source: Public Records
Tax History
| Year | Tax Paid | Tax Assessment Tax Assessment Total Assessment is a certain percentage of the fair market value that is determined by local assessors to be the total taxable value of land and additions on the property. | Land | Improvement |
|---|---|---|---|---|
| 2025 | $2,454 | $396,004 | $111,550 | $284,454 |
| 2023 | $2,454 | $380,628 | $107,219 | $273,409 |
| 2022 | $2,559 | $373,166 | $105,117 | $268,049 |
| 2021 | $4,293 | $365,850 | $103,056 | $262,794 |
| 2020 | $4,247 | $362,100 | $102,000 | $260,100 |
| 2019 | $4,178 | $355,000 | $175,000 | $180,000 |
| 2018 | $1,345 | $246,000 | $126,000 | $120,000 |
| 2017 | $1,251 | $234,000 | $120,000 | $114,000 |
| 2016 | $1,044 | $213,000 | $109,000 | $104,000 |
| 2014 | $850 | $193,000 | $99,000 | $94,000 |
Source: Public Records
Map
Nearby Homes
- 531 N O St
- 526 N L St
- 321 N K St
- 217 N M St
- 510 N I St
- 1011 W Walnut Ave
- 516 N U St
- 1355 Crown Cir
- 267 Village Circle Dr
- 1445 Crown Cir
- 901 Alden Ave
- 23 Village Circle Dr
- 225 Village Circle Dr
- 321 W North Ave Unit 133
- 60 Village Circle Dr
- 117 S I St
- 1408 W Walnut Ave
- 1410 W Apricot Ave
- 112 N X St
- 801, 851 California 246
Your Personal Tour Guide
Ask me questions while you tour the home.