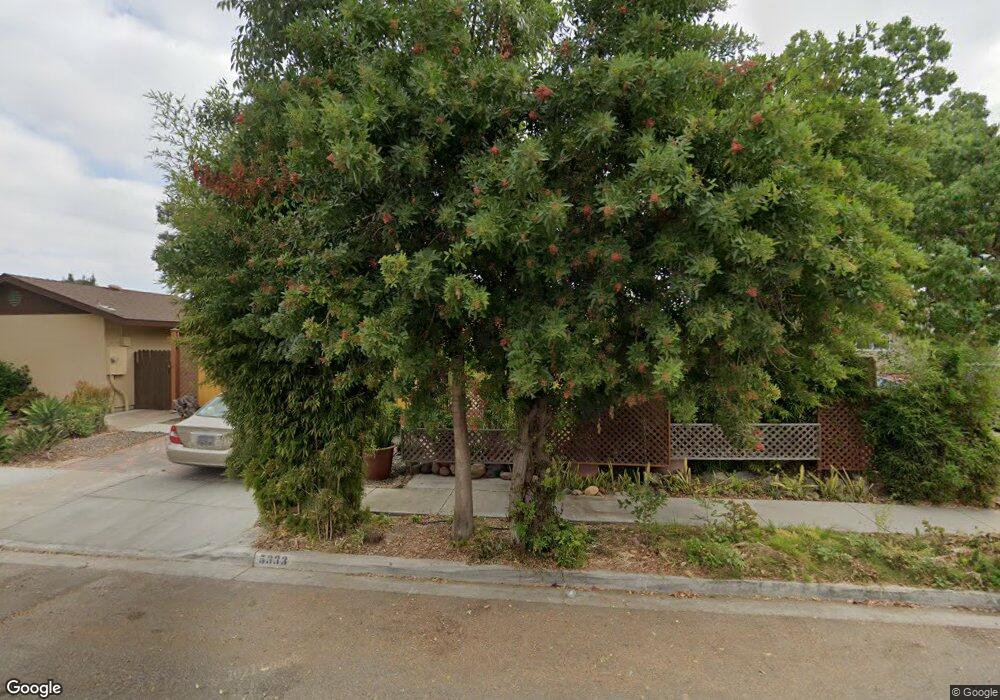
5333 Redding Rd San Diego, CA 92115
College West NeighborhoodEstimated Value: $1,104,000 - $1,380,000
3
Beds
2
Baths
1,895
Sq Ft
$657/Sq Ft
Est. Value
About This Home
This home is located at 5333 Redding Rd, San Diego, CA 92115 and is currently estimated at $1,245,247, approximately $657 per square foot. 5333 Redding Rd is a home located in San Diego County with nearby schools including Hardy Elementary School, Lewis Middle School, and Patrick Henry High School.
Ownership History
Date
Name
Owned For
Owner Type
Purchase Details
Closed on
Feb 25, 2015
Sold by
Dao Ninh An
Bought by
Ninh An Dao & Charles Harrison Haynes Re and Haynes Charles Harrison
Current Estimated Value
Purchase Details
Closed on
Feb 2, 2000
Sold by
Yarbrough Robert D and Carol Mary
Bought by
Yarbrough Todd J
Purchase Details
Closed on
Feb 1, 2000
Sold by
Yarbrough Todd J
Bought by
Dao Ninh A and Haynes Charles H
Purchase Details
Closed on
May 31, 1990
Purchase Details
Closed on
Oct 1, 1986
Purchase Details
Closed on
Feb 1, 1984
Create a Home Valuation Report for This Property
The Home Valuation Report is an in-depth analysis detailing your home's value as well as a comparison with similar homes in the area
Home Values in the Area
Average Home Value in this Area
Purchase History
| Date | Buyer | Sale Price | Title Company |
|---|---|---|---|
| Ninh An Dao & Charles Harrison Haynes Re | -- | Lawyers Title | |
| Yarbrough Todd J | -- | Lawyers Title | |
| Dao Ninh A | $212,000 | Lawyers Title | |
| -- | $200,000 | -- | |
| -- | $129,000 | -- | |
| -- | $125,000 | -- |
Source: Public Records
Tax History Compared to Growth
Tax History
| Year | Tax Paid | Tax Assessment Tax Assessment Total Assessment is a certain percentage of the fair market value that is determined by local assessors to be the total taxable value of land and additions on the property. | Land | Improvement |
|---|---|---|---|---|
| 2025 | $3,841 | $316,136 | $215,170 | $100,966 |
| 2024 | $3,841 | $309,938 | $210,951 | $98,987 |
| 2023 | $3,756 | $303,862 | $206,815 | $97,047 |
| 2022 | $3,656 | $297,905 | $202,760 | $95,145 |
| 2021 | $3,632 | $292,065 | $198,785 | $93,280 |
| 2020 | $3,588 | $289,071 | $196,747 | $92,324 |
| 2019 | $3,524 | $283,404 | $192,890 | $90,514 |
| 2018 | $3,296 | $277,848 | $189,108 | $88,740 |
| 2017 | $3,218 | $272,400 | $185,400 | $87,000 |
| 2016 | $3,166 | $267,060 | $181,765 | $85,295 |
| 2015 | $3,037 | $263,049 | $179,035 | $84,014 |
| 2014 | $2,988 | $257,897 | $175,528 | $82,369 |
Source: Public Records
Map
Nearby Homes
- 5055 Collwood Blvd Unit 319
- 5540 Lindo Paseo Unit 19
- 4940 Defiance Way
- 5045 Collwood Way Unit 33
- 5055 Collwood Way Unit 54
- 5513 Adobe Falls Rd Unit 11
- 4881 Collwood Blvd Unit A
- 4881 Collwood Blvd Unit B
- 4891 Collwood Blvd Unit B
- 5432 Adobe Falls Rd Unit 12
- 5452 Adobe Falls Rd Unit 2
- 5665 Toyon Rd Unit 27
- 5228 Augustana Place
- 5483 Maisel Way
- 4848 54th St
- 5556 Baja Dr
- 4810 Baylor Dr
- 4793 54th St
- 4931 Lorraine Dr
- 4737 Baylor Dr
- 5341 Redding Rd
- 5325 Redding Rd
- 5344 Hewlett Dr
- 5352 Hewlett Dr
- 5336 Hewlett Dr
- 5317 Redding Rd
- 5349 Redding Rd
- 5360 Hewlett Dr
- 5332 Redding Rd
- 5328 Hewlett Dr
- 5324 Redding Rd
- 5340 Redding Rd
- 5357/5359 Redding Rd
- 5357 Redding Rd
- 5309 Redding Rd
- 5318 Redding Rd
- 5368 Hewlett Dr
- 5320 Hewlett Dr
- 5365 Redding Rd
- 5356 Redding Rd