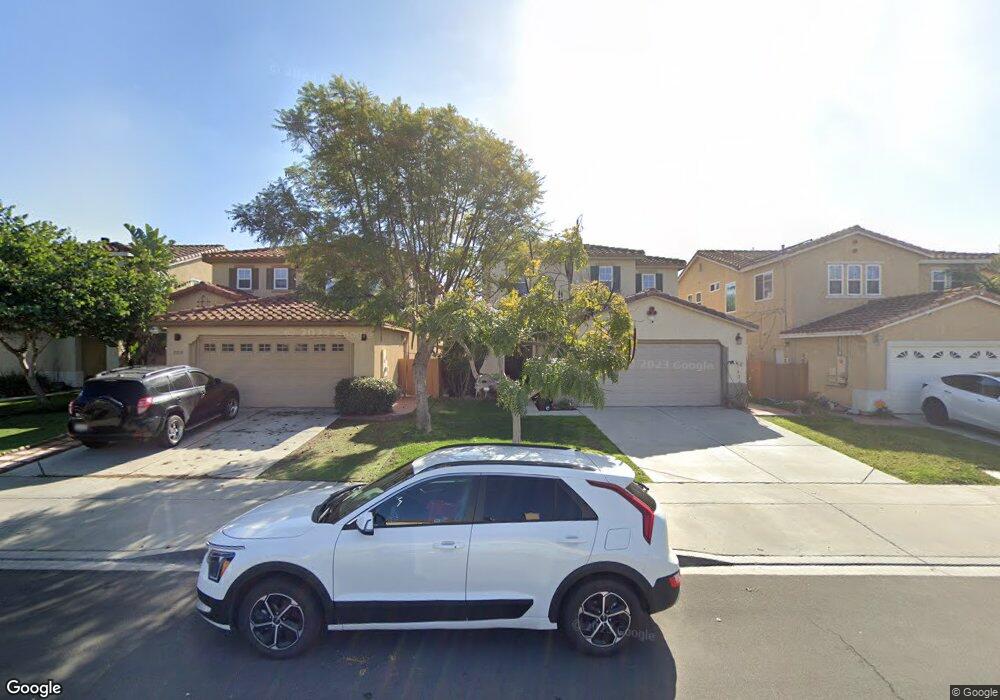
5335 Seaglen Way San Diego, CA 92154
Ocean View Hills NeighborhoodEstimated Value: $813,844 - $886,000
3
Beds
3
Baths
1,677
Sq Ft
$514/Sq Ft
Est. Value
About This Home
This home is located at 5335 Seaglen Way, San Diego, CA 92154 and is currently estimated at $861,711, approximately $513 per square foot. 5335 Seaglen Way is a home located in San Diego County with nearby schools including Ocean View Hills, Vista Del Mar, and San Ysidro Middle School.
Ownership History
Date
Name
Owned For
Owner Type
Purchase Details
Closed on
Nov 29, 2023
Sold by
Figueroa Federico and Figueroa Maria T
Bought by
Figueroa Family Trust and Figueroa
Current Estimated Value
Purchase Details
Closed on
Nov 2, 2010
Sold by
Serna Ramon and Serna Reyna M
Bought by
Figueroa Federico and Figueroa Maria T
Home Financials for this Owner
Home Financials are based on the most recent Mortgage that was taken out on this home.
Original Mortgage
$319,685
Interest Rate
4.37%
Mortgage Type
FHA
Purchase Details
Closed on
Dec 4, 2003
Sold by
Pardee Homes
Bought by
Serna Ramon and Serna Reyna M
Home Financials for this Owner
Home Financials are based on the most recent Mortgage that was taken out on this home.
Original Mortgage
$309,243
Interest Rate
4.75%
Mortgage Type
Purchase Money Mortgage
Create a Home Valuation Report for This Property
The Home Valuation Report is an in-depth analysis detailing your home's value as well as a comparison with similar homes in the area
Home Values in the Area
Average Home Value in this Area
Purchase History
| Date | Buyer | Sale Price | Title Company |
|---|---|---|---|
| Figueroa Family Trust | -- | None Listed On Document | |
| Figueroa Federico | -- | None Listed On Document | |
| Figueroa Federico | $328,000 | Corinthian Title Company | |
| Serna Ramon | $387,000 | Chicago Title Co |
Source: Public Records
Mortgage History
| Date | Status | Borrower | Loan Amount |
|---|---|---|---|
| Previous Owner | Figueroa Federico | $319,685 | |
| Previous Owner | Serna Ramon | $309,243 | |
| Closed | Serna Ramon | $38,655 |
Source: Public Records
Tax History Compared to Growth
Tax History
| Year | Tax Paid | Tax Assessment Tax Assessment Total Assessment is a certain percentage of the fair market value that is determined by local assessors to be the total taxable value of land and additions on the property. | Land | Improvement |
|---|---|---|---|---|
| 2025 | $6,431 | $420,209 | $140,485 | $279,724 |
| 2024 | $6,431 | $411,971 | $137,731 | $274,240 |
| 2023 | $6,300 | $403,894 | $135,031 | $268,863 |
| 2022 | $6,048 | $395,976 | $132,384 | $263,592 |
| 2021 | $6,051 | $388,213 | $129,789 | $258,424 |
| 2020 | $5,949 | $384,234 | $128,459 | $255,775 |
| 2019 | $5,701 | $376,701 | $125,941 | $250,760 |
| 2018 | $5,601 | $369,316 | $123,472 | $245,844 |
| 2017 | $5,512 | $362,075 | $121,051 | $241,024 |
| 2016 | $5,342 | $354,977 | $118,678 | $236,299 |
| 2015 | $5,293 | $349,646 | $116,896 | $232,750 |
| 2014 | $5,223 | $342,798 | $114,607 | $228,191 |
Source: Public Records
Map
Nearby Homes
- 1233 Sandy Cape Ct
- 1210 Jade Cove Ct
- 5317 Westport View Dr
- 5211 Calle Rockfish Unit 90
- 1251 Paseo Sea Breeze Unit 14
- 1251 Paseo Sea Breeze Unit 17
- 1320 Calle Sandcliff Unit 41
- 5140 Calle Sand Arch Unit 61
- 5405 Calle Sand Arch Unit 197
- 5360 Calle Rockfish Unit 32
- 5402 Sand Arch Ln Unit 199
- 1250 Sand Drift Point
- 1270 Paseo Sea Breeze Unit 26
- 5208 Surfwalk Way Unit 153
- 5265 Beachfront Cove Unit 167
- 5261 Beachfront Cove Unit 175
- 5280 Beachfront Cove Unit 239
- 5240 Beachfront Cove Unit 89
- 5305 Seacliff Place
- 5305 Seacliff Place Unit 5
- 5339 Seaglen Way
- 5331 Seaglen Way Unit 7B
- 5343 Seaglen Way
- 5327 Seaglen Way
- 1242 Beryl Cove Point Unit 7B
- 1243 Seagreen Place Unit 7B
- 5347 Seaglen Way Unit 7B
- 5323 Seaglen Way
- 1246 Beryl Cove Point
- 1230 Sea Strand Ln
- 1247 Seagreen Place Unit 7B
- 5351 Seaglen Way
- 1227 Seagreen Place Unit 7B
- 1253 Seagreen Place Unit 7B
- 1226 Sea Strand Ln
- 5355 Seaglen Way
- 1263 Seagreen Place Unit 7B
- 1223 Seagreen Place
- 1231 Sea Strand Ln
- 1273 Seagreen Place Unit 7B