Estimated Value: $490,000 - $599,000
2
Beds
1
Bath
801
Sq Ft
$675/Sq Ft
Est. Value
About This Home
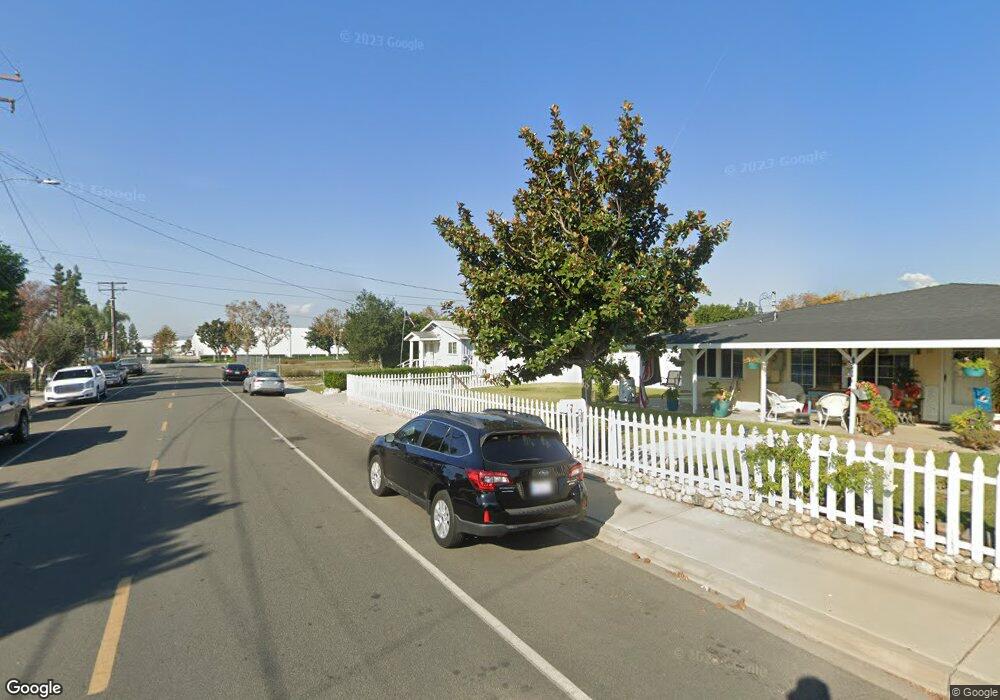
This home is located at 5336 Anderson St, Chino, CA 91710 and is currently estimated at $540,405, approximately $674 per square foot. 5336 Anderson St is a home located in San Bernardino County with nearby schools including Edwin Rhodes Elementary, Magnolia Junior High, and Chino High School.
Ownership History
Date
Name
Owned For
Owner Type
Purchase Details
Closed on
Mar 21, 2013
Sold by
Feldman David E
Bought by
Feldman David
Current Estimated Value
Home Financials for this Owner
Home Financials are based on the most recent Mortgage that was taken out on this home.
Original Mortgage
$126,959
Outstanding Balance
$90,439
Interest Rate
3.75%
Mortgage Type
FHA
Estimated Equity
$449,966
Purchase Details
Closed on
Nov 25, 2008
Sold by
Alcala Frances
Bought by
Feldman David E
Home Financials for this Owner
Home Financials are based on the most recent Mortgage that was taken out on this home.
Original Mortgage
$134,248
Interest Rate
5.14%
Mortgage Type
FHA
Purchase Details
Closed on
Mar 27, 2007
Sold by
Garcia Theresa and Alcala Frances
Bought by
Alcala Frances
Purchase Details
Closed on
Dec 14, 2001
Sold by
Alcala Pedro D
Bought by
Garcia Theresa and Alcala Frances
Create a Home Valuation Report for This Property
The Home Valuation Report is an in-depth analysis detailing your home's value as well as a comparison with similar homes in the area
Home Values in the Area
Average Home Value in this Area
Purchase History
| Date | Buyer | Sale Price | Title Company |
|---|---|---|---|
| Feldman David | -- | Lawyers Title | |
| Feldman David E | $138,500 | Nations Title Company | |
| Alcala Frances | -- | None Available | |
| Garcia Theresa | -- | -- |
Source: Public Records
Mortgage History
| Date | Status | Borrower | Loan Amount |
|---|---|---|---|
| Open | Feldman David | $126,959 | |
| Previous Owner | Feldman David E | $134,248 |
Source: Public Records
Tax History Compared to Growth
Tax History
| Year | Tax Paid | Tax Assessment Tax Assessment Total Assessment is a certain percentage of the fair market value that is determined by local assessors to be the total taxable value of land and additions on the property. | Land | Improvement |
|---|---|---|---|---|
| 2025 | $1,954 | $178,225 | $62,380 | $115,845 |
| 2024 | $1,954 | $174,731 | $61,157 | $113,574 |
| 2023 | $1,900 | $171,305 | $59,958 | $111,347 |
| 2022 | $1,889 | $167,946 | $58,782 | $109,164 |
| 2021 | $1,852 | $164,653 | $57,629 | $107,024 |
| 2020 | $1,829 | $162,965 | $57,038 | $105,927 |
| 2019 | $1,797 | $159,770 | $55,920 | $103,850 |
| 2018 | $1,758 | $156,638 | $54,824 | $101,814 |
| 2017 | $1,727 | $153,567 | $53,749 | $99,818 |
| 2016 | $1,615 | $150,556 | $52,695 | $97,861 |
| 2015 | $1,583 | $148,294 | $51,903 | $96,391 |
| 2014 | $1,552 | $145,389 | $50,886 | $94,503 |
Source: Public Records
Map
Nearby Homes
- 4912 G St
- 13536 Sycamore Ln
- 0 C St
- 13116 3rd St
- 13123 2nd St
- 13358 Yorba Ave
- 13115 Monte Vista Ave
- 13555 Magnolia Ave
- 4621 Chino Ave
- 6046 Lyon St
- 4610 Avondale Ct
- 11610 Granville Place
- 12939 5th St
- 6169 Winona St
- 14212 Willamette Ave
- 12951 Benson Ave Unit 118
- 12940 4th St
- 6147 Davidson St
- 6162 Davidson St
- 6212 Athena St
- 5350 Anderson St
- 0 Anderson St Unit C11097243
- 0 Anderson St Unit CV23140030
- 0 Anderson St Unit CV22034811
- 0 Anderson St Unit CV19007825
- 5319 Anderson St
- 5335 Anderson St
- 5329 Anderson St
- 5329 Anderson St
- 5345 Anderson St
- 5368 Anderson St
- 5353 Anderson St
- 5321 Anderson St
- 5311 Anderson St
- 13779 Central Ave
- 5357 Anderson St
- 5376 Anderson St
- 5359 Anderson St
- 5382 Anderson St
- 13853 Central Ave