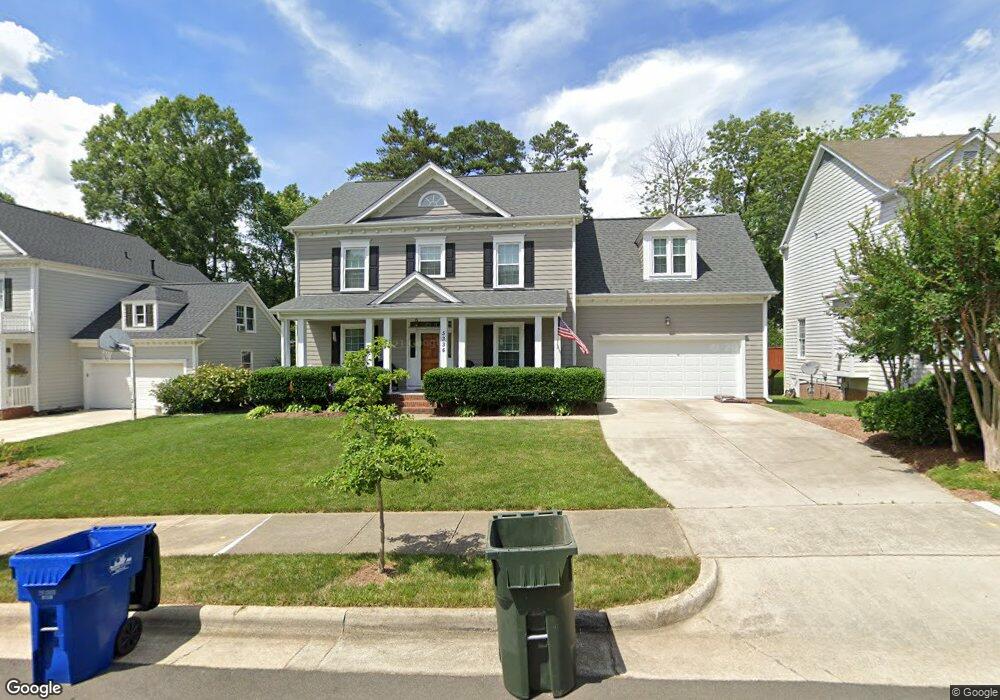
5336 Back Sail Ct Raleigh, NC 27613
Umstead NeighborhoodEstimated Value: $527,705 - $623,000
--
Bed
--
Bath
2,412
Sq Ft
$235/Sq Ft
Est. Value
About This Home
This home is located at 5336 Back Sail Ct, Raleigh, NC 27613 and is currently estimated at $566,176, approximately $234 per square foot. 5336 Back Sail Ct is a home located in Wake County with nearby schools including Sycamore Creek Elementary School, Pine Hollow Middle School, and Leesville Road High School.
Ownership History
Date
Name
Owned For
Owner Type
Purchase Details
Closed on
Sep 12, 2012
Sold by
Lee Mona K and Nisoff Mona K
Bought by
Lee Mona K and Stone William Mark
Current Estimated Value
Home Financials for this Owner
Home Financials are based on the most recent Mortgage that was taken out on this home.
Original Mortgage
$149,000
Outstanding Balance
$24,771
Interest Rate
3.58%
Mortgage Type
New Conventional
Estimated Equity
$541,405
Purchase Details
Closed on
Jan 27, 2005
Sold by
Nisoff John J and Nisoff Mona K
Bought by
Nisoff Mona K
Home Financials for this Owner
Home Financials are based on the most recent Mortgage that was taken out on this home.
Original Mortgage
$175,000
Interest Rate
5.62%
Mortgage Type
New Conventional
Purchase Details
Closed on
Jan 19, 2005
Sold by
The Crosland Group Inc
Bought by
Nisoff John J and Nisoff Mona K
Home Financials for this Owner
Home Financials are based on the most recent Mortgage that was taken out on this home.
Original Mortgage
$175,000
Interest Rate
5.62%
Mortgage Type
New Conventional
Purchase Details
Closed on
Aug 2, 1994
Bought by
Lee Mona K and William Mark Stone
Create a Home Valuation Report for This Property
The Home Valuation Report is an in-depth analysis detailing your home's value as well as a comparison with similar homes in the area
Home Values in the Area
Average Home Value in this Area
Purchase History
| Date | Buyer | Sale Price | Title Company |
|---|---|---|---|
| Lee Mona K | -- | None Available | |
| Nisoff Mona K | -- | -- | |
| Nisoff John J | -- | -- | |
| Lee Mona K | $169,500 | -- |
Source: Public Records
Mortgage History
| Date | Status | Borrower | Loan Amount |
|---|---|---|---|
| Open | Lee Mona K | $149,000 | |
| Previous Owner | Nisoff Mona K | $175,000 |
Source: Public Records
Tax History Compared to Growth
Tax History
| Year | Tax Paid | Tax Assessment Tax Assessment Total Assessment is a certain percentage of the fair market value that is determined by local assessors to be the total taxable value of land and additions on the property. | Land | Improvement |
|---|---|---|---|---|
| 2025 | $4,114 | $469,467 | $160,000 | $309,467 |
| 2024 | $4,097 | $469,467 | $160,000 | $309,467 |
| 2023 | $3,806 | $347,369 | $85,000 | $262,369 |
| 2022 | $3,537 | $347,369 | $85,000 | $262,369 |
| 2021 | $3,400 | $347,369 | $85,000 | $262,369 |
| 2020 | $3,338 | $347,369 | $85,000 | $262,369 |
| 2019 | $3,283 | $281,543 | $90,000 | $191,543 |
| 2018 | $3,096 | $281,543 | $90,000 | $191,543 |
| 2017 | $2,949 | $281,543 | $90,000 | $191,543 |
| 2016 | $2,888 | $281,543 | $90,000 | $191,543 |
| 2015 | $2,749 | $263,571 | $72,000 | $191,571 |
| 2014 | -- | $263,571 | $72,000 | $191,571 |
Source: Public Records
Map
Nearby Homes
- 5000 Morning Edge Dr
- 5024 Dawn Piper Dr
- 5008 Dawn Piper Dr
- 12316 Amoretto Way
- 12200 Inglehurst Dr
- 5233 Fairmead Cir
- 5700 Earlham Ct
- 12316 Inglehurst Dr
- 5216 Sutter Way
- 11113 N Radner Way
- 5316 Easthorpe Dr
- 12018 Mcbride Dr
- 11209 Sedgefield Dr
- 5240 Indigo Moon Way
- 5501 Stewartby Dr
- 5906 Dunzo Dr
- 5952 Dunzo Dr
- 5956 Dunzo Dr
- 5900 Dunzo Dr
- 5904 Dunzo Dr
- 5340 Back Sail Ct
- 5332 Back Sail Ct
- 5727 Covington Bend Dr
- 5328 Back Sail Ct
- 5344 Back Sail Ct
- 12001 Amoretto Way
- 5337 Back Sail Ct
- 5333 Back Sail Ct
- 12005 Amoretto Way
- 12000 Amoretto Way
- 12000 Cadmore Ct
- 5324 Back Sail Ct
- 5329 Back Sail Ct
- 12001 Cadmore Ct
- 5348 Back Sail Ct
- 5261 Covington Bend Dr
- 5248 Covington Bend Dr
- 5325 Back Sail Ct
- 12009 Amoretto Way
- 12008 Cadmore Ct