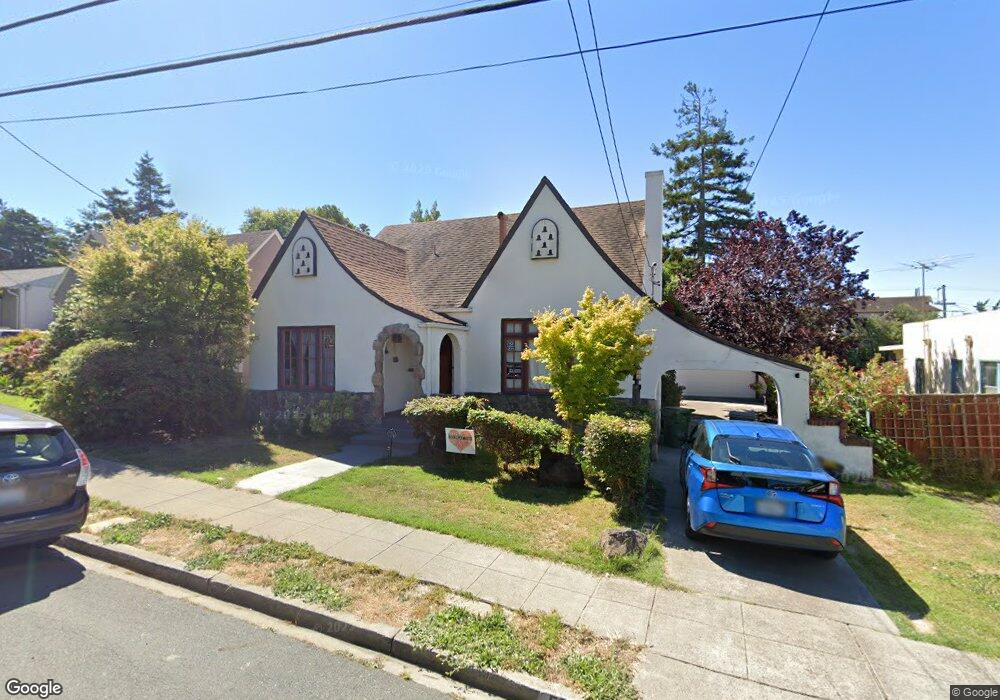
5336 Rosalind Ave El Cerrito, CA 94530
Estimated Value: $1,083,000 - $1,288,000
3
Beds
2
Baths
1,709
Sq Ft
$696/Sq Ft
Est. Value
About This Home
This home is located at 5336 Rosalind Ave, El Cerrito, CA 94530 and is currently estimated at $1,189,055, approximately $695 per square foot. 5336 Rosalind Ave is a home located in Contra Costa County with nearby schools including Mira Vista Elementary School, Fred T. Korematsu Middle School, and El Cerrito Senior High School.
Ownership History
Date
Name
Owned For
Owner Type
Purchase Details
Closed on
Jun 10, 2014
Sold by
Heinzelman Keith and Heinzelman Van Dragt
Bought by
Joseph Natasha and Hall Jonah
Current Estimated Value
Home Financials for this Owner
Home Financials are based on the most recent Mortgage that was taken out on this home.
Original Mortgage
$498,880
Outstanding Balance
$380,172
Interest Rate
4.25%
Mortgage Type
New Conventional
Estimated Equity
$808,883
Purchase Details
Closed on
Sep 17, 2002
Sold by
Tolley Larry G
Bought by
Heinzelman Keith and Vandragt Aimee S
Home Financials for this Owner
Home Financials are based on the most recent Mortgage that was taken out on this home.
Original Mortgage
$360,000
Interest Rate
6.22%
Mortgage Type
Purchase Money Mortgage
Create a Home Valuation Report for This Property
The Home Valuation Report is an in-depth analysis detailing your home's value as well as a comparison with similar homes in the area
Home Values in the Area
Average Home Value in this Area
Purchase History
| Date | Buyer | Sale Price | Title Company |
|---|---|---|---|
| Joseph Natasha | $624,000 | Old Republic Title Company | |
| Heinzelman Keith | $450,000 | Placer Title |
Source: Public Records
Mortgage History
| Date | Status | Borrower | Loan Amount |
|---|---|---|---|
| Open | Joseph Natasha | $498,880 | |
| Previous Owner | Heinzelman Keith | $360,000 | |
| Closed | Heinzelman Keith | $45,000 |
Source: Public Records
Tax History Compared to Growth
Tax History
| Year | Tax Paid | Tax Assessment Tax Assessment Total Assessment is a certain percentage of the fair market value that is determined by local assessors to be the total taxable value of land and additions on the property. | Land | Improvement |
|---|---|---|---|---|
| 2025 | $10,858 | $764,438 | $551,634 | $212,804 |
| 2024 | $10,659 | $749,450 | $540,818 | $208,632 |
| 2023 | $10,659 | $734,756 | $530,214 | $204,542 |
| 2022 | $10,500 | $720,350 | $519,818 | $200,532 |
| 2021 | $10,460 | $706,226 | $509,626 | $196,600 |
| 2019 | $9,815 | $685,281 | $494,511 | $190,770 |
| 2018 | $9,475 | $671,845 | $484,815 | $187,030 |
| 2017 | $9,325 | $658,672 | $475,309 | $183,363 |
| 2016 | $9,296 | $645,758 | $465,990 | $179,768 |
| 2015 | $9,332 | $636,059 | $458,991 | $177,068 |
| 2014 | $7,946 | $536,735 | $341,147 | $195,588 |
Source: Public Records
Map
Nearby Homes
- 5340 Barrett Ave
- 2502 Yuba St
- 2530 Edwards Ave
- 5120 Prather Ave
- 5326 Silva Ave
- 5212 Macdonald Ave
- 455 Key Blvd
- 611 Amador St
- 2711 Tulare Ave
- 2400 Mira Vista Dr
- 527 Mclaughlin St
- 418 Wilson Ave
- 2063 Tapscott Ave
- 604 Key Blvd
- 6445 Hagen Blvd
- 2030 Junction Ave
- 2022 Junction Ave
- 2028 Mira Vista Dr
- 2021 Key Blvd
- 1909 Francisco Way
- 5364 Rosalind Ave
- 5356 Rosalind Ave
- 5334 Rosalind Ave
- 5332 Rosalind Ave
- 5320 Rosalind Ave
- 5340 Rosalind Ave
- 5387 Rosalind Ave
- 5337 Rosalind Ave
- 5335 Rosalind Ave
- 2507 Harris Ave
- 5333 Rosalind Ave
- 5370 Rosalind Ave
- 5351 Poinsett Ave
- 5347 Poinsett Ave
- 5355 Poinsett Ave
- 5343 Poinsett Ave
- 5435 Poinsett Ave
- 5330 Rosalind Ave
- 5331 Rosalind Ave
- 5437 Poinsett Ave