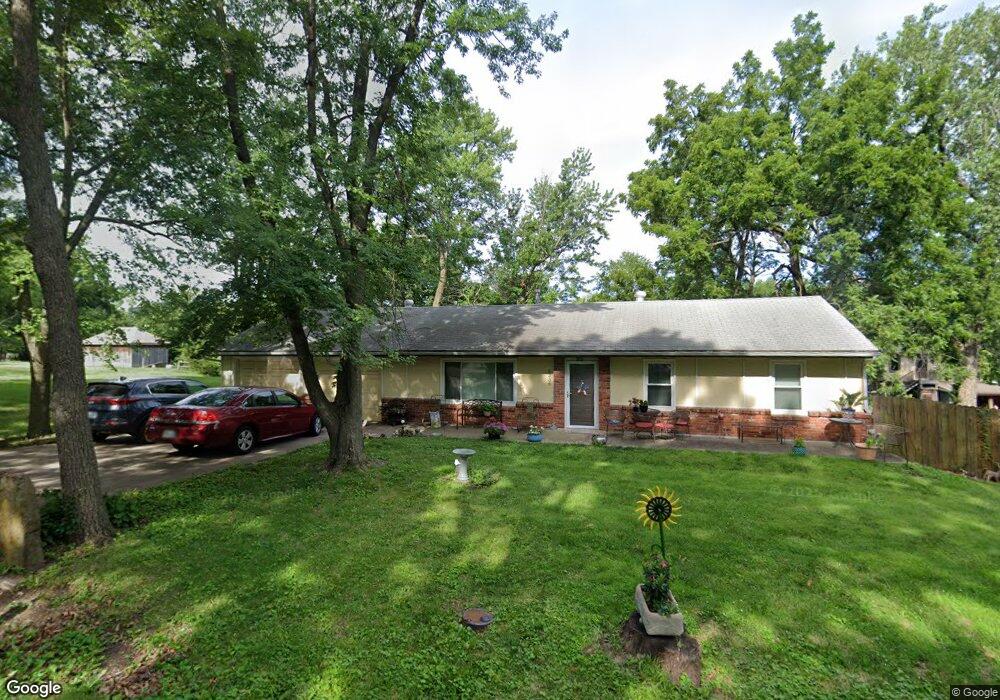
5336 Rosehill Rd Shawnee, KS 66216
Estimated Value: $290,520 - $334,000
2
Beds
2
Baths
1,056
Sq Ft
$292/Sq Ft
Est. Value
About This Home
This home is located at 5336 Rosehill Rd, Shawnee, KS 66216 and is currently estimated at $308,880, approximately $292 per square foot. 5336 Rosehill Rd is a home located in Johnson County with nearby schools including Ray Marsh Elementary School, Trailridge Middle School, and Shawnee Mission Northwest High School.
Ownership History
Date
Name
Owned For
Owner Type
Purchase Details
Closed on
Sep 2, 2019
Sold by
Green Janell B and Meyer Joyce M
Bought by
Pauli William Chris and Pauli Kathleen A
Current Estimated Value
Purchase Details
Closed on
Dec 29, 2009
Sold by
Green Janell B
Bought by
Green Janell B and Meyer Joyce M
Home Financials for this Owner
Home Financials are based on the most recent Mortgage that was taken out on this home.
Original Mortgage
$97,250
Interest Rate
4.8%
Mortgage Type
New Conventional
Purchase Details
Closed on
Apr 13, 2004
Sold by
Green John M
Bought by
Green Jannell B
Home Financials for this Owner
Home Financials are based on the most recent Mortgage that was taken out on this home.
Original Mortgage
$83,000
Interest Rate
5.97%
Mortgage Type
Purchase Money Mortgage
Create a Home Valuation Report for This Property
The Home Valuation Report is an in-depth analysis detailing your home's value as well as a comparison with similar homes in the area
Home Values in the Area
Average Home Value in this Area
Purchase History
| Date | Buyer | Sale Price | Title Company |
|---|---|---|---|
| Pauli William Chris | -- | Alpha Title Guaranty Inc | |
| Green Janell B | -- | All American Title Company | |
| Green Jannell B | -- | Montgomery Home Title Inc |
Source: Public Records
Mortgage History
| Date | Status | Borrower | Loan Amount |
|---|---|---|---|
| Previous Owner | Green Janell B | $97,250 | |
| Previous Owner | Green Jannell B | $83,000 |
Source: Public Records
Tax History Compared to Growth
Tax History
| Year | Tax Paid | Tax Assessment Tax Assessment Total Assessment is a certain percentage of the fair market value that is determined by local assessors to be the total taxable value of land and additions on the property. | Land | Improvement |
|---|---|---|---|---|
| 2024 | $3,360 | $31,947 | $6,829 | $25,118 |
| 2023 | $3,101 | $28,980 | $6,209 | $22,771 |
| 2022 | $2,757 | $25,679 | $5,638 | $20,041 |
| 2021 | $2,766 | $24,070 | $4,904 | $19,166 |
| 2020 | $2,582 | $22,161 | $4,460 | $17,701 |
| 2019 | $2,407 | $20,631 | $4,250 | $16,381 |
| 2018 | $2,241 | $20,665 | $4,250 | $16,415 |
| 2017 | $2,131 | $17,894 | $3,864 | $14,030 |
| 2016 | $2,014 | $16,687 | $3,864 | $12,823 |
| 2015 | $1,804 | $15,617 | $3,864 | $11,753 |
| 2013 | -- | $14,858 | $3,864 | $10,994 |
Source: Public Records
Map
Nearby Homes
- 12508 W 56th St
- 5504 Monrovia St
- 13130 W 52nd Terrace
- 13126 W 52nd Terrace
- 13134 W 52nd Terrace
- 5620 Monrovia St
- 5507 Noland Rd
- 13305 W 51st St
- 5407 Halsey St
- 5021 Bradshaw St
- 12809 W 57th Terrace
- 5013 Bradshaw St
- 11815 W 53rd St
- 5300 Summit Ct
- 5807 Noland Rd
- 14170 W 49th St
- 5845 Caenen St
- 13810 W 53rd St
- 5530 Rene St
- 11907 W 49th Place
- 12800 W 55th St
- 5409 Westgate St
- 5412 Westgate St
- 5434 Rosehill Rd
- 5413 Westgate St
- 5421 Rosehill Rd
- 5418 Westgate St
- 5417 Westgate St
- 5425 Rosehill Rd
- 5331 Rosehill Rd
- 5424 Westgate St
- 5429 Rosehill Rd
- 12704 W 55th St
- 5421 Westgate St
- 12808 W 55th St
- 12710 W 55th St
- 12802 W 55th St
- 5432 Westgate St
- 12718 W 55th St
- 5425 Westgate St