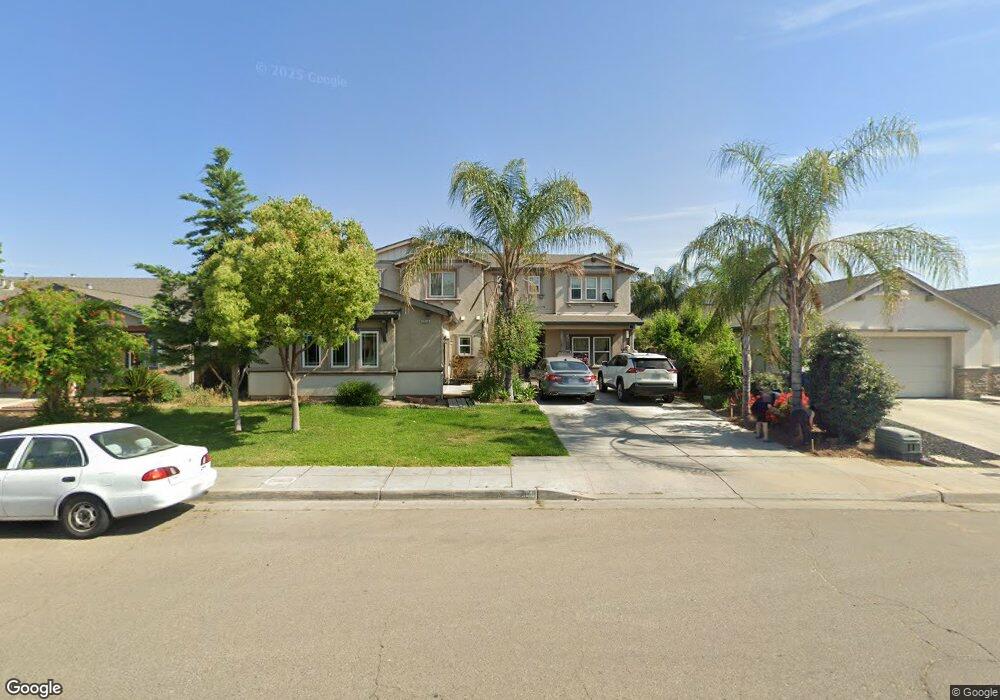
5336 W Normal Ave Fresno, CA 93722
West Fresno NeighborhoodEstimated Value: $463,642 - $488,000
5
Beds
3
Baths
2,586
Sq Ft
$183/Sq Ft
Est. Value
About This Home
This home is located at 5336 W Normal Ave, Fresno, CA 93722 and is currently estimated at $472,911, approximately $182 per square foot. 5336 W Normal Ave is a home located in Fresno County with nearby schools including James K. Polk Elementary, El Capitan Middle School, and Central East High School.
Ownership History
Date
Name
Owned For
Owner Type
Purchase Details
Closed on
Oct 17, 2023
Sold by
Wacha Lor and Vang Lee Chia
Bought by
Lor Wacha and Lee Chia Vang
Current Estimated Value
Purchase Details
Closed on
Oct 11, 2023
Sold by
Lor Wacha and Lee Chia Vang
Bought by
Lor Wacha and Lee Chia Vang
Purchase Details
Closed on
Nov 4, 2011
Sold by
Lor Wacha and Vue Toua
Bought by
Vang Lor Wacha and Vang Lee Chia
Purchase Details
Closed on
Sep 1, 2009
Sold by
The Bank Of New York Mellon
Bought by
Lor Wacha and Vue Toua
Home Financials for this Owner
Home Financials are based on the most recent Mortgage that was taken out on this home.
Original Mortgage
$198,412
Interest Rate
4.83%
Mortgage Type
FHA
Purchase Details
Closed on
May 20, 2009
Sold by
Her Yang
Bought by
The Bank Of New York Mellon and Bac Home Loans Servicing Lp
Purchase Details
Closed on
Feb 3, 2006
Sold by
Kb Home South Bay Inc
Bought by
Her Yang
Home Financials for this Owner
Home Financials are based on the most recent Mortgage that was taken out on this home.
Original Mortgage
$289,746
Interest Rate
6.62%
Mortgage Type
New Conventional
Create a Home Valuation Report for This Property
The Home Valuation Report is an in-depth analysis detailing your home's value as well as a comparison with similar homes in the area
Home Values in the Area
Average Home Value in this Area
Purchase History
| Date | Buyer | Sale Price | Title Company |
|---|---|---|---|
| Lor Wacha | -- | None Listed On Document | |
| Lor Wacha | -- | None Listed On Document | |
| Vang Lor Wacha | -- | None Available | |
| Lor Wacha | $210,000 | North American Title Company | |
| The Bank Of New York Mellon | $157,250 | Landsafe Title | |
| Her Yang | $311,000 | First American Title Ins Co |
Source: Public Records
Mortgage History
| Date | Status | Borrower | Loan Amount |
|---|---|---|---|
| Previous Owner | Lor Wacha | $198,412 | |
| Previous Owner | Her Yang | $289,746 |
Source: Public Records
Tax History Compared to Growth
Tax History
| Year | Tax Paid | Tax Assessment Tax Assessment Total Assessment is a certain percentage of the fair market value that is determined by local assessors to be the total taxable value of land and additions on the property. | Land | Improvement |
|---|---|---|---|---|
| 2025 | $3,432 | $254,848 | $60,525 | $194,323 |
| 2023 | $3,432 | $244,954 | $58,176 | $186,778 |
| 2022 | $3,038 | $240,152 | $57,036 | $183,116 |
| 2021 | $3,050 | $235,444 | $55,918 | $179,526 |
| 2020 | $2,995 | $233,031 | $55,345 | $177,686 |
| 2019 | $2,920 | $228,462 | $54,260 | $174,202 |
| 2018 | $2,779 | $223,984 | $53,197 | $170,787 |
| 2017 | $2,761 | $219,593 | $52,154 | $167,439 |
| 2016 | $2,585 | $215,288 | $51,132 | $164,156 |
| 2015 | $2,540 | $212,055 | $50,364 | $161,691 |
| 2014 | $2,538 | $207,902 | $49,378 | $158,524 |
Source: Public Records
Map
Nearby Homes
- 5585 W Cotton Ave
- 5109 W Clinton Ave
- 2123 N Lodi Ave
- 5565 W Lamona Ave
- 1613 N Ellendale Ave
- 1887 N Belvedere Ave
- 2210 N Antioch Ave
- 17 Acre Lot McKinley & Hayes
- 1656 N Cecelia Ave
- 2393 N Blythe Ave
- 1741 N Blythe Ave
- 4569 W Michigan Ave
- 2437 N Tracy Ave
- 4765 W Shields Ave
- 1714 N Blythe Ave
- 4360 W Vassar Ave
- 4694 W Shields Ave
- 5866 W Shields Ave
- 3125 N Milburn Ave
- 2387 N Hanover Ave
- 5328 W Normal Ave
- 5354 W Normal Ave
- 5335 W Cotton Ave
- 5329 W Cotton Ave
- 5351 W Cotton Ave
- 5316 W Normal Ave
- 5362 W Normal Ave
- 5317 W Cotton Ave
- 5359 W Cotton Ave
- 5338 W University Ave
- 5306 W Normal Ave
- 5374 W Normal Ave
- 5364 W University Ave
- 5321 W Normal Ave
- 5309 W Cotton Ave
- 5371 W Cotton Ave
- 5311 W Normal Ave
- 5372 W University Ave
- 5298 W Normal Ave
- 5380 W Normal Ave