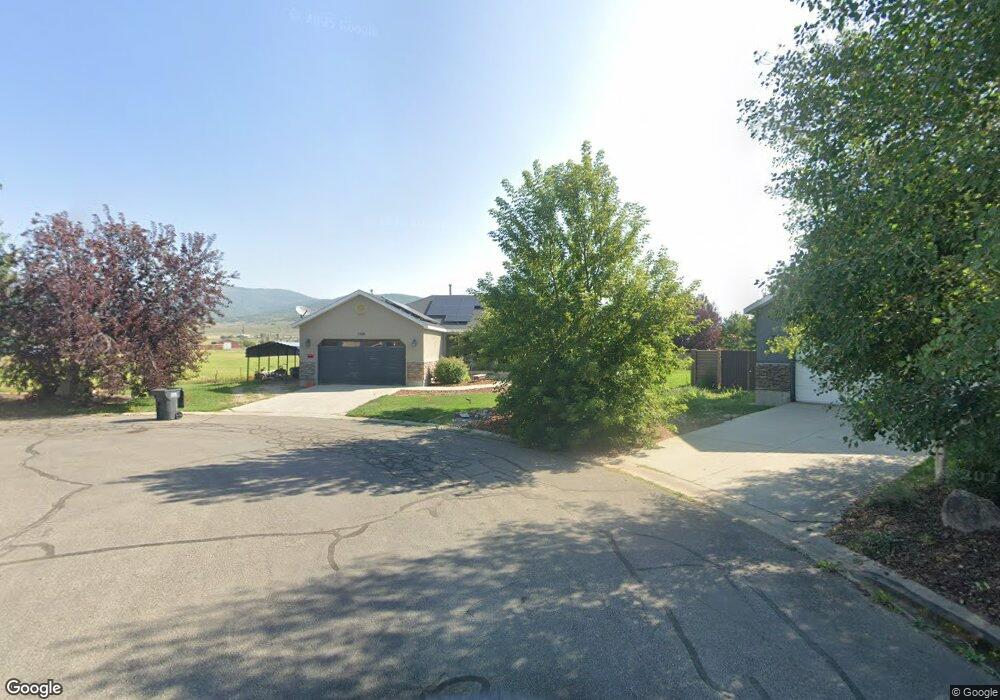
5338 Frontier Cir Oakley, UT 84055
Estimated Value: $705,288 - $865,000
Studio
1
Bath
1,639
Sq Ft
$474/Sq Ft
Est. Value
About This Home
This home is located at 5338 Frontier Cir, Oakley, UT 84055 and is currently estimated at $777,572, approximately $474 per square foot. 5338 Frontier Cir is a home located in Summit County with nearby schools including South Summit Elementary School and South Summit High School.
Ownership History
Date
Name
Owned For
Owner Type
Purchase Details
Closed on
Oct 15, 2010
Sold by
Clegg Stephanie Ann and Clegg James Douglas
Bought by
Clegg Stephanie Ann and Clegg James Douglas
Current Estimated Value
Home Financials for this Owner
Home Financials are based on the most recent Mortgage that was taken out on this home.
Original Mortgage
$226,400
Outstanding Balance
$73,155
Interest Rate
4.45%
Mortgage Type
New Conventional
Estimated Equity
$704,417
Purchase Details
Closed on
Sep 14, 2010
Sold by
Clegg James Douglas and Clegg Stephanie Ann
Bought by
Clegg Stephanie Ann and Clegg James Douglas
Home Financials for this Owner
Home Financials are based on the most recent Mortgage that was taken out on this home.
Original Mortgage
$226,400
Outstanding Balance
$73,155
Interest Rate
4.45%
Mortgage Type
New Conventional
Estimated Equity
$704,417
Purchase Details
Closed on
Nov 6, 2006
Sold by
Mountainladns Community Housing Assn
Bought by
Clegg James Douglas and Clegg Stephanie Ann
Home Financials for this Owner
Home Financials are based on the most recent Mortgage that was taken out on this home.
Original Mortgage
$207,900
Interest Rate
6.37%
Mortgage Type
New Conventional
Create a Home Valuation Report for This Property
The Home Valuation Report is an in-depth analysis detailing your home's value as well as a comparison with similar homes in the area
Home Values in the Area
Average Home Value in this Area
Purchase History
| Date | Buyer | Sale Price | Title Company |
|---|---|---|---|
| Clegg Stephanie Ann | -- | -- | |
| Clegg Stephanie Ann | -- | -- | |
| Clegg James Douglas | -- | None Available |
Source: Public Records
Mortgage History
| Date | Status | Borrower | Loan Amount |
|---|---|---|---|
| Open | Clegg Stephanie Ann | $226,400 | |
| Previous Owner | Clegg James Douglas | $207,900 |
Source: Public Records
Tax History
| Year | Tax Paid | Tax Assessment Tax Assessment Total Assessment is a certain percentage of the fair market value that is determined by local assessors to be the total taxable value of land and additions on the property. | Land | Improvement |
|---|---|---|---|---|
| 2025 | $2,260 | $376,266 | $137,500 | $238,766 |
| 2024 | $2,256 | $381,457 | $137,500 | $243,957 |
| 2023 | $2,256 | $381,457 | $137,500 | $243,957 |
| 2022 | $1,924 | $291,612 | $110,000 | $181,612 |
| 2021 | $1,800 | $228,716 | $71,500 | $157,216 |
| 2020 | $1,605 | $188,713 | $54,450 | $134,263 |
| 2019 | $1,801 | $188,713 | $54,450 | $134,263 |
| 2018 | $1,549 | $169,227 | $48,950 | $120,277 |
| 2017 | $1,417 | $158,777 | $38,500 | $120,277 |
| 2016 | $1,431 | $150,385 | $38,500 | $111,885 |
| 2015 | $1,420 | $150,385 | $0 | $0 |
| 2013 | $1,408 | $140,235 | $0 | $0 |
Source: Public Records
Map
Nearby Homes
- 5325 Bridle Cir
- 829 River Haven Ln Unit 111
- 972 River Haven Rd Unit 101
- 949 River Haven Rd S Unit 115
- 87 N Yosemite Unit 87A
- 940 River Haven Rd W Unit 103
- 156 Mountain View Unit 156
- 455 W North Bench Rd
- 919 River Haven Rd Unit 114
- 4275 N Riverview Ct
- 672 Carson Ln
- 4165 Conifer Dr
- 816 River Haven Rd Unit 106
- 389 E Boulderville Rd
- 3994 N New Ln
- 364 W 3700 N
- 5954 N Maple Ridge Trail Unit 6
- 6117 Rocky Ridge Rd
- 2575 W State Road 32
- 470 E Boulderville Rd
- 5326 Frontier Cir
- 5337 Bridle Cir
- 5341 Frontier Cir
- 5308 Frontier Cir
- 5329 Frontier Cir
- 5315 Frontier Cir
- 808 Bronc Trail
- 834 Bronc Trail
- 5301 Frontier Cir
- 5301 Frontier Cir Unit 68
- 844 Bronc Trail
- 5336 Western Cir
- 5340 Bridle Cir
- 5324 Western Cir
- 5328 Bridle Cir
- 5308 Western Cir
- 5310 Bridle Cir
- 5284 Western Cir
- 5272 N 750 W
- 5294 Bridle Cir
Your Personal Tour Guide
Ask me questions while you tour the home.