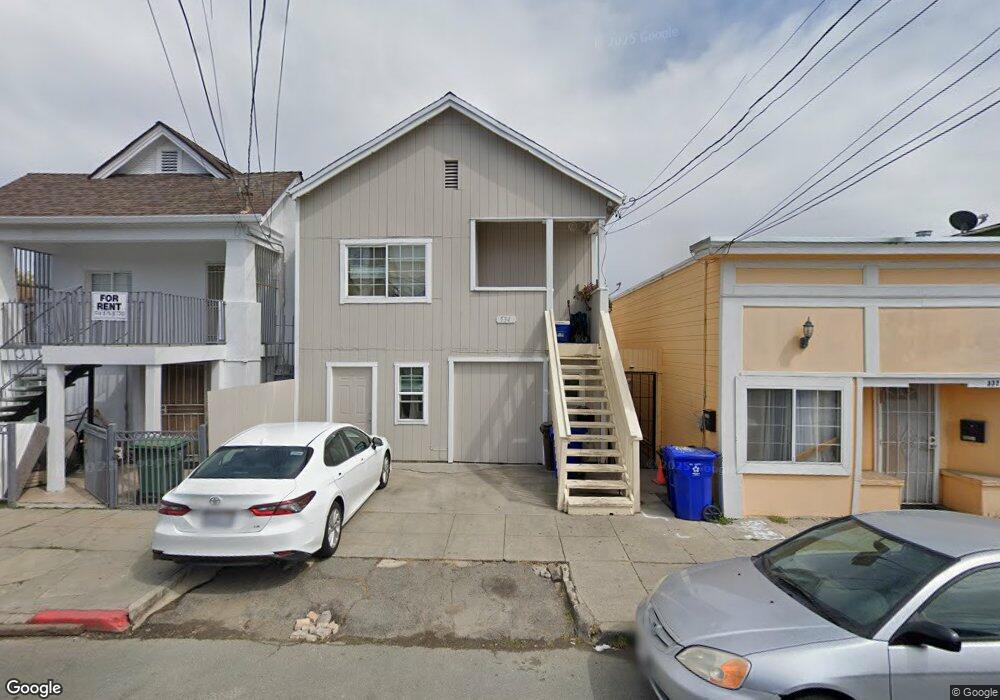
534 19th St Richmond, CA 94801
Belding Woods NeighborhoodEstimated Value: $400,000 - $438,811
3
Beds
1
Bath
998
Sq Ft
$416/Sq Ft
Est. Value
About This Home
This home is located at 534 19th St, Richmond, CA 94801 and is currently estimated at $414,703, approximately $415 per square foot. 534 19th St is a home located in Contra Costa County with nearby schools including Grant Elementary School, Lovonya DeJean Middle School, and John F. Kennedy High School.
Ownership History
Date
Name
Owned For
Owner Type
Purchase Details
Closed on
Aug 25, 2003
Sold by
Garcia Susana
Bought by
Garcia Jorge
Current Estimated Value
Home Financials for this Owner
Home Financials are based on the most recent Mortgage that was taken out on this home.
Original Mortgage
$160,000
Outstanding Balance
$71,124
Interest Rate
5.75%
Mortgage Type
Purchase Money Mortgage
Estimated Equity
$343,579
Purchase Details
Closed on
Dec 11, 1997
Sold by
Spoon Kaufman Gloria
Bought by
Torres Pablo
Purchase Details
Closed on
Jun 3, 1997
Sold by
Kaiperm Fcu
Bought by
Torres Pablo and Spoon Kaufman Gloria
Home Financials for this Owner
Home Financials are based on the most recent Mortgage that was taken out on this home.
Original Mortgage
$75,000
Interest Rate
7.98%
Mortgage Type
Seller Take Back
Purchase Details
Closed on
Mar 12, 1997
Sold by
Klopson Wanda O
Bought by
Kaiperm Fcu
Create a Home Valuation Report for This Property
The Home Valuation Report is an in-depth analysis detailing your home's value as well as a comparison with similar homes in the area
Home Values in the Area
Average Home Value in this Area
Purchase History
| Date | Buyer | Sale Price | Title Company |
|---|---|---|---|
| Garcia Jorge | -- | Fidelity National Title | |
| Garcia Jorge | $200,000 | Fidelity National Title | |
| Torres Pablo | $40,000 | First American Title | |
| Torres Pablo | $80,000 | First American Title Guarant | |
| Kaiperm Fcu | $76,586 | -- |
Source: Public Records
Mortgage History
| Date | Status | Borrower | Loan Amount |
|---|---|---|---|
| Open | Garcia Jorge | $160,000 | |
| Previous Owner | Torres Pablo | $75,000 | |
| Closed | Garcia Jorge | $40,000 |
Source: Public Records
Tax History
| Year | Tax Paid | Tax Assessment Tax Assessment Total Assessment is a certain percentage of the fair market value that is determined by local assessors to be the total taxable value of land and additions on the property. | Land | Improvement |
|---|---|---|---|---|
| 2025 | $5,416 | $284,339 | $178,496 | $105,843 |
| 2024 | $5,248 | $278,765 | $174,997 | $103,768 |
| 2023 | $5,248 | $273,300 | $171,566 | $101,734 |
| 2022 | $5,131 | $267,942 | $168,202 | $99,740 |
| 2021 | $5,056 | $262,689 | $164,904 | $97,785 |
| 2019 | $4,740 | $254,900 | $160,014 | $94,886 |
| 2018 | $4,541 | $248,000 | $155,682 | $92,318 |
| 2017 | $4,101 | $220,000 | $138,106 | $81,894 |
| 2016 | $3,454 | $175,500 | $110,171 | $65,329 |
| 2015 | $3,451 | $175,500 | $110,171 | $65,329 |
| 2014 | $2,872 | $134,500 | $84,433 | $50,067 |
Source: Public Records
Map
Nearby Homes
Your Personal Tour Guide
Ask me questions while you tour the home.