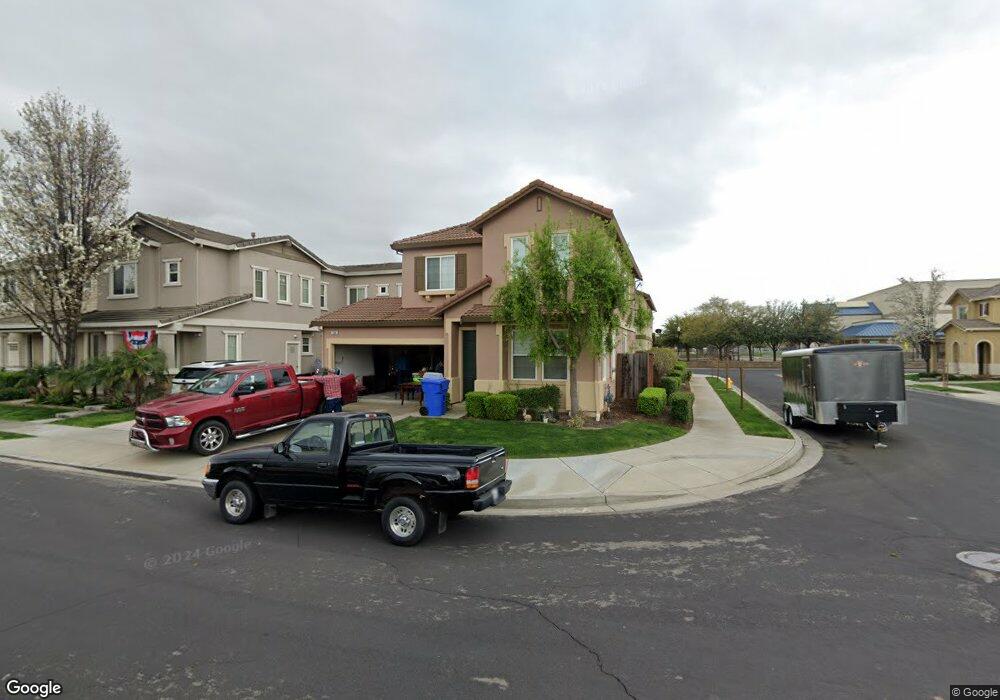
534 Almanor St Brentwood, CA 94513
Garin Ranch NeighborhoodEstimated Value: $649,366 - $726,000
3
Beds
3
Baths
1,801
Sq Ft
$380/Sq Ft
Est. Value
About This Home
This home is located at 534 Almanor St, Brentwood, CA 94513 and is currently estimated at $683,842, approximately $379 per square foot. 534 Almanor St is a home located in Contra Costa County with nearby schools including Garin Elementary School, Edna Hill Middle School, and Liberty High School.
Ownership History
Date
Name
Owned For
Owner Type
Purchase Details
Closed on
Nov 20, 2009
Sold by
Wellens Stephen C and Wellens Sara
Bought by
Forlow Doreen E
Current Estimated Value
Purchase Details
Closed on
Apr 13, 2006
Sold by
Mousai Behzad
Bought by
Wellens Stephen C and Sot Sara
Home Financials for this Owner
Home Financials are based on the most recent Mortgage that was taken out on this home.
Original Mortgage
$460,000
Interest Rate
6.66%
Mortgage Type
Negative Amortization
Purchase Details
Closed on
Jan 24, 2005
Sold by
Signature Properties Inc
Bought by
Mousai Behzad
Home Financials for this Owner
Home Financials are based on the most recent Mortgage that was taken out on this home.
Original Mortgage
$349,841
Interest Rate
5.87%
Mortgage Type
Purchase Money Mortgage
Purchase Details
Closed on
Sep 20, 2004
Sold by
Mousai Michelle R
Bought by
Mousai Behzad
Create a Home Valuation Report for This Property
The Home Valuation Report is an in-depth analysis detailing your home's value as well as a comparison with similar homes in the area
Home Values in the Area
Average Home Value in this Area
Purchase History
| Date | Buyer | Sale Price | Title Company |
|---|---|---|---|
| Forlow Doreen E | $240,000 | Old Republic Title Company | |
| Wellens Stephen C | $575,000 | Commonwealth Land Title Co | |
| Mousai Behzad | $437,500 | Old Republic Title | |
| Mousai Behzad | -- | Old Republic Title |
Source: Public Records
Mortgage History
| Date | Status | Borrower | Loan Amount |
|---|---|---|---|
| Previous Owner | Wellens Stephen C | $460,000 | |
| Previous Owner | Mousai Behzad | $349,841 | |
| Closed | Mousai Behzad | $87,461 |
Source: Public Records
Tax History Compared to Growth
Tax History
| Year | Tax Paid | Tax Assessment Tax Assessment Total Assessment is a certain percentage of the fair market value that is determined by local assessors to be the total taxable value of land and additions on the property. | Land | Improvement |
|---|---|---|---|---|
| 2025 | $5,899 | $309,783 | $36,135 | $273,648 |
| 2024 | $5,796 | $303,710 | $35,427 | $268,283 |
| 2023 | $5,796 | $297,756 | $34,733 | $263,023 |
| 2022 | $5,685 | $291,918 | $34,052 | $257,866 |
| 2021 | $5,544 | $286,195 | $33,385 | $252,810 |
| 2019 | $5,507 | $277,708 | $32,396 | $245,312 |
| 2018 | $5,241 | $272,263 | $31,761 | $240,502 |
| 2017 | $5,222 | $266,926 | $31,139 | $235,787 |
| 2016 | $5,062 | $261,693 | $30,529 | $231,164 |
| 2015 | $4,935 | $257,763 | $30,071 | $227,692 |
| 2014 | $4,875 | $241,000 | $28,115 | $212,885 |
Source: Public Records
Map
Nearby Homes
- 389 Black Rock St
- 773 Redhaven St
- 561 Mendota St
- 532 Petunia Ct
- 472 Chicory Ct
- 8500 Brentwood Blvd
- 0 Oak St
- 465 Blue Flax Ct
- 0000 Brentwood Blvd
- 876 Boone Dr E
- 3660 Walnut Blvd Unit 40
- 3660 Walnut Blvd Unit 72
- 3660 Walnut Blvd Unit 46
- 3660 Walnut Blvd Unit 65
- 5140 Balfour Rd
- 877 Boone Dr E
- 4603 Balfour Rd Unit 11
- 4603 Balfour Rd Unit 58
- 4603 Balfour Rd Unit 83
- 4603 Balfour Rd Unit 47
- 538 Almanor St
- 378 Topaz St
- 374 Topaz St
- 370 Topaz St
- 503 Arrowhead St
- 507 Arrowhead St
- 499 Arrowhead St
- 546 Almanor St
- 533 Almanor St
- 511 Arrowhead St
- 366 Topaz St
- 537 Almanor St
- 495 Arrowhead St
- 541 Almanor St
- 515 Arrowhead St
- 550 Almanor St
- 362 Topaz St
- 545 Almanor St
- 398 Black Rock St
- 519 Arrowhead St