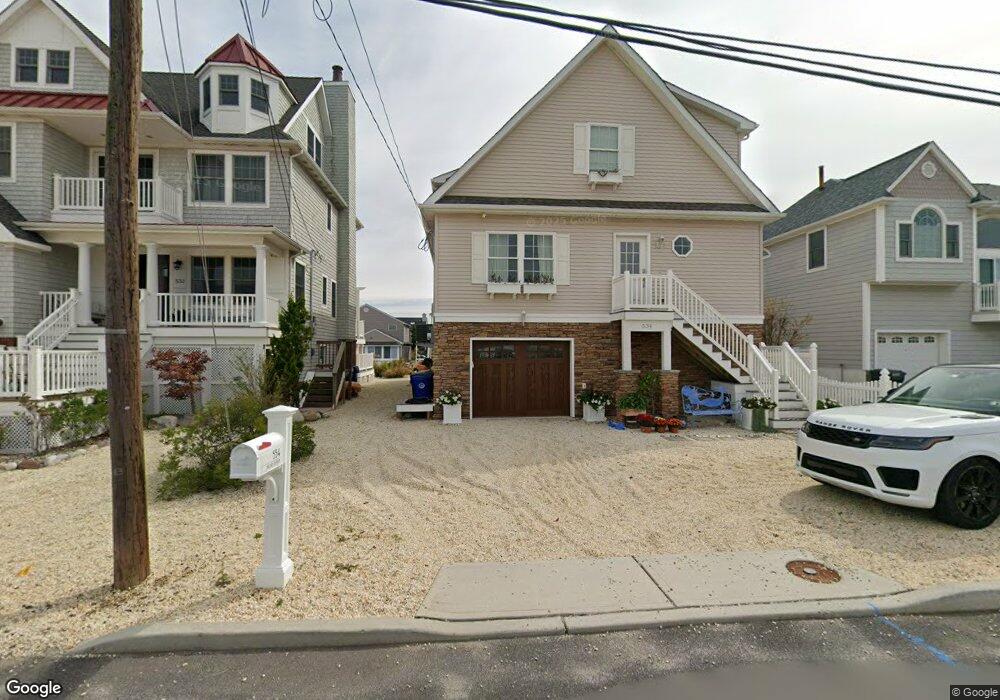
534 Broad Ave Mantoloking, NJ 08738
Estimated Value: $2,009,000 - $2,152,251
4
Beds
3
Baths
3,502
Sq Ft
$591/Sq Ft
Est. Value
About This Home
This home is located at 534 Broad Ave, Mantoloking, NJ 08738 and is currently estimated at $2,069,813, approximately $591 per square foot. 534 Broad Ave is a home with nearby schools including Emma Havens Young Elementary School, Lake Riviera Middle School, and Brick Township High School.
Ownership History
Date
Name
Owned For
Owner Type
Purchase Details
Closed on
Oct 12, 2018
Sold by
Delguercio Ernest F
Bought by
Hengst Harold Scott and Hengst Nicole
Current Estimated Value
Home Financials for this Owner
Home Financials are based on the most recent Mortgage that was taken out on this home.
Original Mortgage
$748,000
Outstanding Balance
$652,300
Interest Rate
4.5%
Mortgage Type
New Conventional
Estimated Equity
$1,417,513
Purchase Details
Closed on
Nov 3, 2015
Sold by
266 Rock Llc
Bought by
Guercio Ernest F Del
Purchase Details
Closed on
May 21, 2014
Sold by
Denman Douglass J and Denman Elaine B
Bought by
266 Rock Llc
Purchase Details
Closed on
Jun 8, 2007
Sold by
Denman Douglass J and Denman Elaine B
Bought by
Denman Douglass J and Denman Elaine B
Create a Home Valuation Report for This Property
The Home Valuation Report is an in-depth analysis detailing your home's value as well as a comparison with similar homes in the area
Home Values in the Area
Average Home Value in this Area
Purchase History
| Date | Buyer | Sale Price | Title Company |
|---|---|---|---|
| Hengst Harold Scott | $935,000 | First American Title | |
| Guercio Ernest F Del | -- | None Available | |
| Guercio Ernest F Del | -- | Attorney | |
| 266 Rock Llc | $435,000 | Alta | |
| Denman Douglass J | -- | None Available |
Source: Public Records
Mortgage History
| Date | Status | Borrower | Loan Amount |
|---|---|---|---|
| Open | Hengst Harold Scott | $748,000 |
Source: Public Records
Tax History Compared to Growth
Tax History
| Year | Tax Paid | Tax Assessment Tax Assessment Total Assessment is a certain percentage of the fair market value that is determined by local assessors to be the total taxable value of land and additions on the property. | Land | Improvement |
|---|---|---|---|---|
| 2025 | $20,850 | $807,200 | $450,000 | $357,200 |
| 2024 | $19,817 | $807,200 | $450,000 | $357,200 |
| 2023 | $19,558 | $807,200 | $450,000 | $357,200 |
| 2022 | $19,558 | $807,200 | $450,000 | $357,200 |
| 2021 | $19,147 | $807,200 | $450,000 | $357,200 |
| 2020 | $18,905 | $807,200 | $450,000 | $357,200 |
| 2019 | $18,590 | $807,200 | $450,000 | $357,200 |
| 2018 | $10,125 | $450,000 | $450,000 | $0 |
| 2017 | $9,851 | $450,000 | $450,000 | $0 |
| 2016 | $9,910 | $455,000 | $450,000 | $5,000 |
| 2015 | $11,666 | $550,000 | $492,800 | $57,200 |
| 2014 | $11,572 | $550,000 | $492,800 | $57,200 |
Source: Public Records
Map
Nearby Homes
- 254 Harbor Ct
- 515 New Jersey 35
- 545 Route 35
- 12 Shell Rd
- 438 Highway 35 N Unit 1304
- 417 Delray Dr
- 26 N Surf Rd
- 465 Boca Raton Dr
- 257 Strickland Blvd
- 34 S Surf Rd
- 366 Highway 35 N
- 348 Venice Dr
- 366 Fort Meyers Ct
- 37 E Flamingo Way
- 108 W Sandpiper Way
- 109 W Sandpiper Way
- 102 W Pompano Way
- 308 Cove Dr
- 236 Gull Ln
- 208 Mallard Ln