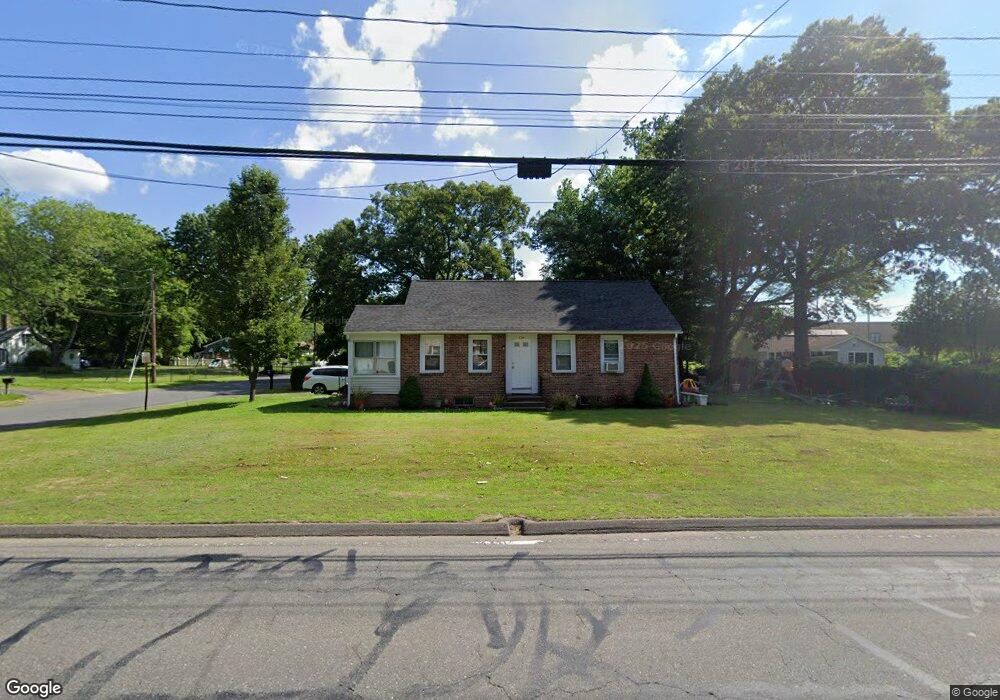
534 Chapin St Ludlow, MA 01056
Estimated Value: $270,000 - $291,000
2
Beds
1
Bath
999
Sq Ft
$282/Sq Ft
Est. Value
About This Home
This home is located at 534 Chapin St, Ludlow, MA 01056 and is currently estimated at $281,299, approximately $281 per square foot. 534 Chapin St is a home located in Hampden County with nearby schools including East Street Elementary School, Chapin Street Elementary School, and Paul R. Baird Middle School.
Ownership History
Date
Name
Owned For
Owner Type
Purchase Details
Closed on
Dec 29, 2011
Sold by
Deponte Mary L
Bought by
Jorge Melissa P
Current Estimated Value
Home Financials for this Owner
Home Financials are based on the most recent Mortgage that was taken out on this home.
Original Mortgage
$102,000
Outstanding Balance
$35,345
Interest Rate
4%
Mortgage Type
Purchase Money Mortgage
Estimated Equity
$245,954
Create a Home Valuation Report for This Property
The Home Valuation Report is an in-depth analysis detailing your home's value as well as a comparison with similar homes in the area
Home Values in the Area
Average Home Value in this Area
Purchase History
| Date | Buyer | Sale Price | Title Company |
|---|---|---|---|
| Jorge Melissa P | $127,500 | -- | |
| Jorge Melissa P | $127,500 | -- |
Source: Public Records
Mortgage History
| Date | Status | Borrower | Loan Amount |
|---|---|---|---|
| Open | Jorge Melissa P | $102,000 | |
| Closed | Jorge Melissa P | $102,000 |
Source: Public Records
Tax History Compared to Growth
Tax History
| Year | Tax Paid | Tax Assessment Tax Assessment Total Assessment is a certain percentage of the fair market value that is determined by local assessors to be the total taxable value of land and additions on the property. | Land | Improvement |
|---|---|---|---|---|
| 2025 | $3,430 | $197,700 | $65,800 | $131,900 |
| 2024 | $3,386 | $187,200 | $65,600 | $121,600 |
| 2023 | $3,120 | $159,900 | $54,600 | $105,300 |
| 2022 | $2,967 | $148,400 | $54,600 | $93,800 |
| 2021 | $2,974 | $141,100 | $54,600 | $86,500 |
| 2020 | $2,850 | $138,200 | $53,700 | $84,500 |
| 2019 | $2,666 | $134,500 | $53,200 | $81,300 |
| 2018 | $2,496 | $131,300 | $53,200 | $78,100 |
| 2017 | $2,405 | $129,800 | $54,200 | $75,600 |
| 2016 | $2,283 | $125,900 | $53,100 | $72,800 |
| 2015 | $2,142 | $123,900 | $52,600 | $71,300 |
Source: Public Records
Map
Nearby Homes
- 51 Parkview St
- 70 Sroka Ln
- 142 Amherst St
- 84 Chapin Greene Dr
- 148 Yale St
- 517 Ideal Ln Unit 401
- 87 Haviland St
- 138 Ridgeview Cir
- 42 Loopley St
- 60 Loopley St
- 665 Center St Unit 705
- 665 Center St Unit 311
- 665 Center St Unit 706
- 32 White St
- 41 Orchard St
- 98 Fuller St Unit 32
- 84 Fuller St Unit 1
- 415 Winsor St
- 70 Fuller St
- 287 East St