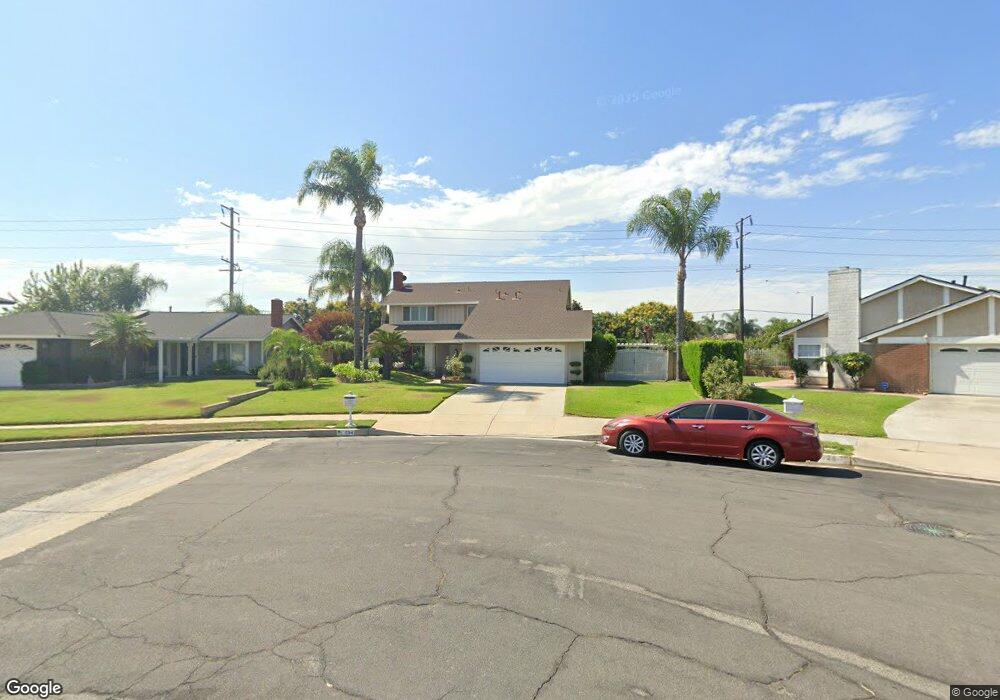
534 E Cherry Hill St Ontario, CA 91761
Downtown Ontario NeighborhoodEstimated Value: $746,000 - $858,000
4
Beds
3
Baths
1,920
Sq Ft
$418/Sq Ft
Est. Value
About This Home
This home is located at 534 E Cherry Hill St, Ontario, CA 91761 and is currently estimated at $802,491, approximately $417 per square foot. 534 E Cherry Hill St is a home located in San Bernardino County with nearby schools including Sultana Elementary School, De Anza Middle, and Ontario High School.
Ownership History
Date
Name
Owned For
Owner Type
Purchase Details
Closed on
Sep 5, 2012
Sold by
Mora Lionel
Bought by
Mora Lionel and Mora Velma
Current Estimated Value
Home Financials for this Owner
Home Financials are based on the most recent Mortgage that was taken out on this home.
Original Mortgage
$219,000
Interest Rate
3.47%
Mortgage Type
New Conventional
Purchase Details
Closed on
Aug 18, 2006
Sold by
Mora Lionel
Bought by
Mora Lionel and Mora Velma
Create a Home Valuation Report for This Property
The Home Valuation Report is an in-depth analysis detailing your home's value as well as a comparison with similar homes in the area
Home Values in the Area
Average Home Value in this Area
Purchase History
| Date | Buyer | Sale Price | Title Company |
|---|---|---|---|
| Mora Lionel | -- | Lawyers Title | |
| Mora Lionel | -- | Lawyers Title | |
| Mora Lionel | -- | None Available |
Source: Public Records
Mortgage History
| Date | Status | Borrower | Loan Amount |
|---|---|---|---|
| Closed | Mora Lionel | $219,000 |
Source: Public Records
Tax History
| Year | Tax Paid | Tax Assessment Tax Assessment Total Assessment is a certain percentage of the fair market value that is determined by local assessors to be the total taxable value of land and additions on the property. | Land | Improvement |
|---|---|---|---|---|
| 2025 | $3,669 | $335,641 | $111,657 | $223,984 |
| 2024 | $3,585 | $329,060 | $109,468 | $219,592 |
| 2023 | $3,485 | $322,608 | $107,322 | $215,286 |
| 2022 | $3,438 | $316,283 | $105,218 | $211,065 |
| 2021 | $3,416 | $310,081 | $103,155 | $206,926 |
| 2020 | $3,356 | $306,901 | $102,097 | $204,804 |
| 2019 | $3,326 | $300,883 | $100,095 | $200,788 |
| 2018 | $3,280 | $294,983 | $98,132 | $196,851 |
| 2017 | $3,162 | $289,199 | $96,208 | $192,991 |
| 2016 | $3,038 | $283,529 | $94,322 | $189,207 |
| 2015 | $3,017 | $279,270 | $92,905 | $186,365 |
| 2014 | $2,924 | $273,799 | $91,085 | $182,714 |
Source: Public Records
Map
Nearby Homes
- 513 E Fairfield Ct
- 2300 S Sultana Ave Unit 298
- 2300 S Sultana Ave Unit 286
- 2300 S Sultana Ave Unit 256
- 2300 S Sultana Ave Unit 206
- 619 E Joseph Privado
- 125 E Saint Andrews St
- 2408 S Taylor Place
- 2819 S Euclid Ave
- 310 E Philadelphia St Unit 147
- 310 E Philadelphia St Unit SPC 102
- 683 E Joseph Privado
- 2333 S Via Esplanade Unit 29
- 665 E Riverside Dr Unit 3
- 2350 S Via Esplanade Unit 31
- 320 W Walnut St Unit 51
- 250 W Via Presido Unit 105
- 2119 S Phoenix Place
- 12482 Silkleaf Ave
- 4315 S Grasly Paseo
- 540 E Cherry Hill St
- 528 E Cherry Hill St
- 546 E Cherry Hill St
- 2546 S Pleasant Ave
- 539 E Cherry Hill St
- 533 E Bermuda Dunes St
- 2540 S Pleasant Ave
- 525 E Bermuda Dunes St
- 541 E Bermuda Dunes St
- 547 E Cherry Hill St
- 2557 S Sultana Ave
- 2551 S Sultana Ave
- 549 E Bermuda Dunes St
- 2545 S Sultana Ave
- 2534 S Pleasant Ave
- 555 E Cherry Hill St
- 2539 S Sultana Ave
- 2634 S Pleasant Ave
- 2621 S Sultana Ave
- 2557 S Monterey Ave
Your Personal Tour Guide
Ask me questions while you tour the home.