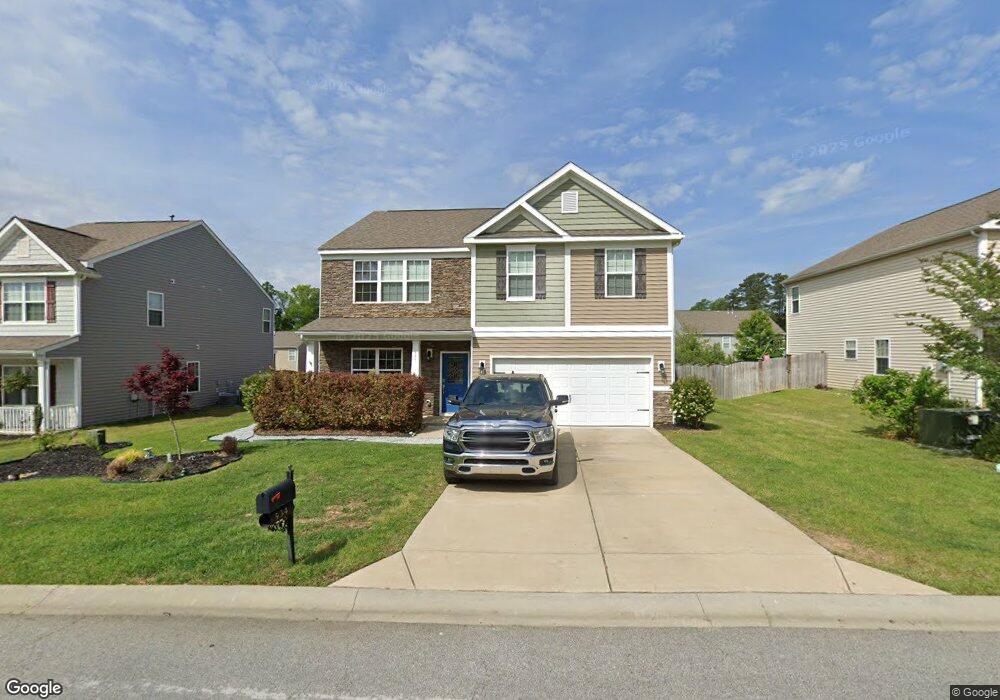
534 Eagles Rest Dr Chapin, SC 29036
Estimated Value: $333,000 - $351,000
5
Beds
3
Baths
2,476
Sq Ft
$138/Sq Ft
Est. Value
About This Home
This home is located at 534 Eagles Rest Dr, Chapin, SC 29036 and is currently estimated at $340,462, approximately $137 per square foot. 534 Eagles Rest Dr is a home located in Richland County with nearby schools including Lake Murray Elementary School, Chapin Intermediate, and Chapin High School.
Ownership History
Date
Name
Owned For
Owner Type
Purchase Details
Closed on
Oct 24, 2019
Sold by
Genworth Mortgage Insurance Corporation
Bought by
Dawkins Johnny M and Mathias Brandie B
Current Estimated Value
Home Financials for this Owner
Home Financials are based on the most recent Mortgage that was taken out on this home.
Original Mortgage
$201,286
Outstanding Balance
$177,228
Interest Rate
3.75%
Mortgage Type
FHA
Estimated Equity
$163,234
Purchase Details
Closed on
Apr 15, 2019
Sold by
Fannie Mae
Bought by
Genworth Mortgage Insurance Corporation
Purchase Details
Closed on
Nov 8, 2018
Sold by
Urso Jeffrey F and Homebridge Financial Services
Bought by
Federal National Mortgage Association and Fannie Mae
Purchase Details
Closed on
May 13, 2016
Sold by
Dr Horton Inc
Bought by
Urso Jeffrey F
Home Financials for this Owner
Home Financials are based on the most recent Mortgage that was taken out on this home.
Original Mortgage
$194,750
Interest Rate
3.59%
Mortgage Type
New Conventional
Create a Home Valuation Report for This Property
The Home Valuation Report is an in-depth analysis detailing your home's value as well as a comparison with similar homes in the area
Home Values in the Area
Average Home Value in this Area
Purchase History
| Date | Buyer | Sale Price | Title Company |
|---|---|---|---|
| Dawkins Johnny M | $205,000 | None Available | |
| Genworth Mortgage Insurance Corporation | -- | None Available | |
| Federal National Mortgage Association | $190,000 | None Available | |
| Urso Jeffrey F | $205,000 | None Available |
Source: Public Records
Mortgage History
| Date | Status | Borrower | Loan Amount |
|---|---|---|---|
| Open | Dawkins Johnny M | $201,286 | |
| Previous Owner | Urso Jeffrey F | $194,750 |
Source: Public Records
Tax History
| Year | Tax Paid | Tax Assessment Tax Assessment Total Assessment is a certain percentage of the fair market value that is determined by local assessors to be the total taxable value of land and additions on the property. | Land | Improvement |
|---|---|---|---|---|
| 2024 | $2,089 | $235,800 | $0 | $0 |
| 2023 | $2,008 | $8,200 | $0 | $0 |
| 2022 | $1,744 | $205,000 | $41,000 | $164,000 |
| 2021 | $1,757 | $8,200 | $0 | $0 |
| 2020 | $5,766 | $12,300 | $0 | $0 |
| 2019 | $5,913 | $12,350 | $0 | $0 |
| 2018 | $1,613 | $8,200 | $0 | $0 |
| 2017 | $1,571 | $8,200 | $0 | $0 |
| 2016 | $512 | $1,640 | $0 | $0 |
Source: Public Records
Map
Nearby Homes
- 384 Explorer Dr
- 379 Explorer Dr
- 371 Explorer Dr
- 818 Sunseeker Dr
- 310 Explorer Dr
- 301 Explorer Dr
- 149 Lakeport Dr
- 207 Murray Falls Ln
- 748 Moonsail Cir
- 143 Collins Cove Dr
- 769 Helmsman Ln
- 34 Elk Run Ct
- 756 Helmsman Ln
- 28 Elk Run Ct
- 20 Elk Run Ct
- 319 Sienna Dr
- 29 Elk Run Ct
- 19 Elk Run Ct
- 1116 Silver Point Rd
- 105 Shores Edge Dr
- 538 Eagles Rest Dr
- 530 Eagles Rest Dr
- 366 Explorer Dr
- 370 Explorer Dr
- 540 Eagles Rest Dr
- 362 Explorer Dr
- 526 Eagles Rest Dr
- 374 Explorer Dr
- 535 Eagles Rest Dr
- 358 Explorer Dr
- 358 Explorer Dr
- 531 Eagles Rest Dr
- 539 Eagles Rest Dr
- 380 Explorer Dr
- 354 Explorer Dr
- 544 Eagles Rest Dr
- 524 Eagles Rest Dr
- 525 Eagles Rest Dr
- 545 Eagles Rest Dr
- 352 Explorer Dr
Your Personal Tour Guide
Ask me questions while you tour the home.