
Seller's Agent in 2021
Lisa Reyes
McColly Real Estate
(630) 518-6328
105 Total Sales


Estimated Value: $210,000 - $243,000
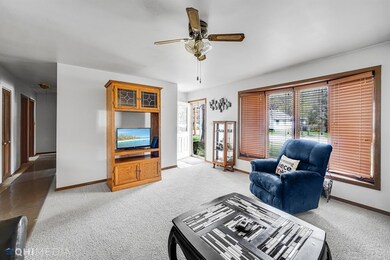
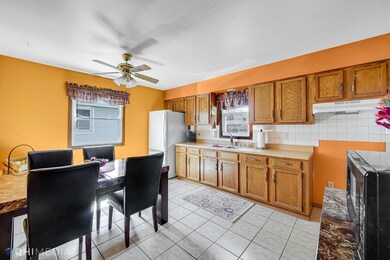
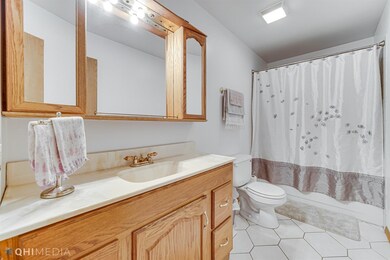
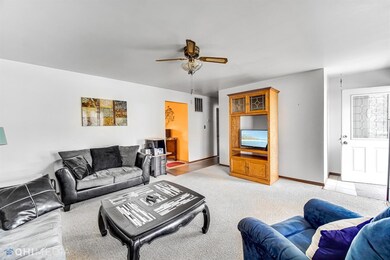
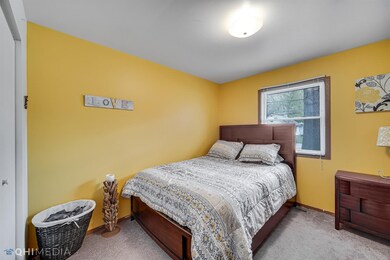
Cozy ranch HOME located in Griffith Indiana. This home features 3 bed 1 bath, HUGE fenced in back yard for entertainment. Home has been very well maintained. Easy access to the express way. close proximity to shopping centers and restaurants!!! ONLY 45 MINUTES to the WINDY CITY CHICAGO!!!!! Not to mention LOW TAXES!!!!!!!!!! WOW WOW WOW!!!Call your agent today!!!!
Last Agent to Sell the Property
McColly Real Estate License #RB16001301 Listed on: 04/16/2021
Last Buyer's Agent
Non-Member Agent
Non-Member MLS Office
We collect this data history from publicly available records. To have your information removed, we recommend requesting removal directly through your county’s website.
We collect this data history from publicly available records. To have your information removed, we recommend requesting removal directly through your county’s website.
| Date | Buyer | Sale Price | Title Company |
|---|---|---|---|
| $165,000 | Fidelity National Title | ||
| -- | Ct |
We collect this data history from publicly available records. To have your information removed, we recommend requesting removal directly through your county’s website.
| Date | Status | Borrower | Loan Amount |
|---|---|---|---|
| Open | $162,011 | ||
| Previous Owner | $72,000 | ||
| Previous Owner | $74,000 |
We collect this data history from publicly available records. To have your information removed, we recommend requesting removal directly through your county’s website.
| Date | Event | Price | List to Sale | Price per Sq Ft |
|---|---|---|---|---|
| 07/09/2021 07/09/21 | Sold | $165,000 | 0.0% | $147 / Sq Ft |
| 06/09/2021 06/09/21 | Pending | -- | -- | -- |
| 04/16/2021 04/16/21 | For Sale | $165,000 | -- | $147 / Sq Ft |
We collect this data history from publicly available records. To have your information removed, we recommend requesting removal directly through your county’s website.
| Year | Tax Paid | Tax Assessment Tax Assessment Total Assessment is a certain percentage of the fair market value that is determined by local assessors to be the total taxable value of land and additions on the property. | Land | Improvement |
|---|---|---|---|---|
| 2025 | $1,731 | $165,700 | $34,200 | $131,500 |
| 2024 | $4,871 | $157,000 | $34,200 | $122,800 |
| 2023 | $1,576 | $148,700 | $34,200 | $114,500 |
| 2022 | $1,576 | $139,100 | $34,200 | $104,900 |
| 2021 | $1,210 | $123,100 | $25,000 | $98,100 |
| 2020 | $1,170 | $119,000 | $25,000 | $94,000 |
| 2019 | $1,135 | $111,000 | $21,000 | $90,000 |
| 2018 | $936 | $97,100 | $20,000 | $77,100 |
| 2017 | $943 | $97,900 | $20,000 | $77,900 |
| 2016 | $1,007 | $97,800 | $20,000 | $77,800 |
| 2014 | $906 | $92,100 | $20,000 | $72,100 |
| 2013 | $931 | $91,000 | $20,000 | $71,000 |
Seller's Agent in 2021
Lisa Reyes
McColly Real Estate
(630) 518-6328
105 Total Sales
N
Buyer's Agent in 2021
Non-Member Agent
Non-Member MLS Office
Source: Northwest Indiana Association of REALTORS®
MLS Number: 491305
APN: 45-07-35-283-010.000-006
Disclaimer: Certain information contained herein is derived from information provided by parties other than Homes.com. All information provided is deemed reliable, but is not guaranteed to be accurate and should be independently verified.
![]() All data is obtained from various sources and may not have been verified by broker or MLS GRID. Supplied Open House Information is subject to change without notice. All information should be independently reviewed and verified for accuracy. Properties may or may not be listed by the office/agent presenting the information. Some IDX listings have been excluded from this website. Copyright 2026 Multiple Listing Service of the Northwest Indiana Realtors Association Multiple Listing Service (NIRA MLS). All rights reserved. IDX information is provided exclusively for personal, non-commercial use, and may not be used for any purpose other than to identify prospective properties consumers may be interested in purchasing. Information is deemed reliable but not guaranteed.
All data is obtained from various sources and may not have been verified by broker or MLS GRID. Supplied Open House Information is subject to change without notice. All information should be independently reviewed and verified for accuracy. Properties may or may not be listed by the office/agent presenting the information. Some IDX listings have been excluded from this website. Copyright 2026 Multiple Listing Service of the Northwest Indiana Realtors Association Multiple Listing Service (NIRA MLS). All rights reserved. IDX information is provided exclusively for personal, non-commercial use, and may not be used for any purpose other than to identify prospective properties consumers may be interested in purchasing. Information is deemed reliable but not guaranteed.
Listings courtesy of Northwest Indiana Association of REALTORS® as distributed by MLS GRID.
Based on information submitted to the MLS GRID
Ask me questions while you tour the home.