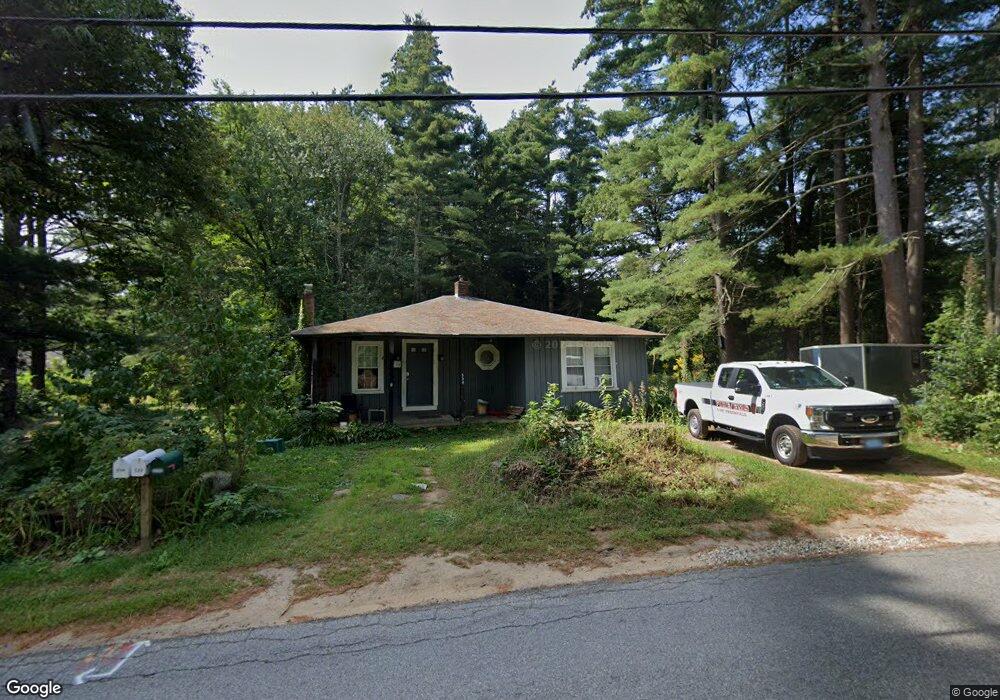
534 Podunk Rd East Brookfield, MA 01515
Estimated Value: $299,000 - $350,000
3
Beds
2
Baths
1,104
Sq Ft
$300/Sq Ft
Est. Value
About This Home
This home is located at 534 Podunk Rd, East Brookfield, MA 01515 and is currently estimated at $331,221, approximately $300 per square foot. 534 Podunk Rd is a home located in Worcester County with nearby schools including David Prouty High School.
Ownership History
Date
Name
Owned For
Owner Type
Purchase Details
Closed on
Feb 28, 2006
Sold by
Messier Rebecca and Messier Stephen
Bought by
Messier David A
Current Estimated Value
Home Financials for this Owner
Home Financials are based on the most recent Mortgage that was taken out on this home.
Original Mortgage
$168,000
Outstanding Balance
$94,947
Interest Rate
6.17%
Mortgage Type
Purchase Money Mortgage
Estimated Equity
$236,274
Create a Home Valuation Report for This Property
The Home Valuation Report is an in-depth analysis detailing your home's value as well as a comparison with similar homes in the area
Home Values in the Area
Average Home Value in this Area
Purchase History
| Date | Buyer | Sale Price | Title Company |
|---|---|---|---|
| Messier David A | $165,000 | -- |
Source: Public Records
Mortgage History
| Date | Status | Borrower | Loan Amount |
|---|---|---|---|
| Open | Messier David A | $168,000 |
Source: Public Records
Tax History
| Year | Tax Paid | Tax Assessment Tax Assessment Total Assessment is a certain percentage of the fair market value that is determined by local assessors to be the total taxable value of land and additions on the property. | Land | Improvement |
|---|---|---|---|---|
| 2025 | $3,405 | $265,200 | $76,900 | $188,300 |
| 2024 | $2,929 | $229,400 | $70,400 | $159,000 |
| 2023 | $2,927 | $223,300 | $64,300 | $159,000 |
| 2022 | $2,826 | $208,900 | $53,900 | $155,000 |
| 2021 | $2,778 | $187,300 | $53,900 | $133,400 |
| 2020 | $2,654 | $179,100 | $53,900 | $125,200 |
| 2019 | $2,782 | $168,900 | $53,900 | $115,000 |
| 2018 | $2,622 | $169,600 | $53,700 | $115,900 |
| 2017 | $2,556 | $157,000 | $49,700 | $107,300 |
| 2016 | $2,574 | $147,400 | $49,700 | $97,700 |
| 2015 | $2,559 | $147,400 | $49,700 | $97,700 |
| 2014 | $2,576 | $147,900 | $49,700 | $98,200 |
Source: Public Records
Map
Nearby Homes
- 117 Draper Rd
- 145 Draper Rd
- 100 Rice Rd
- 110 Pondview Rd
- 1 Lane 22
- 126 Howe St
- 23 William Casey Rd
- 294 E Main St
- 78 S Spencer Rd
- Lot 97/99 E Main St
- 112 Gleason Ave
- 59 Cranberry Meadow Shore Rd
- 17 Conestoga Trail
- 86 Rice Corner Rd
- 6 Stagecoach Dr
- 35 Nashoba Rd
- 49 Jennings Rd
- 0 Hiland Rd
- 53 Fitzgerald Rd
- 18 Tyler St
Your Personal Tour Guide
Ask me questions while you tour the home.