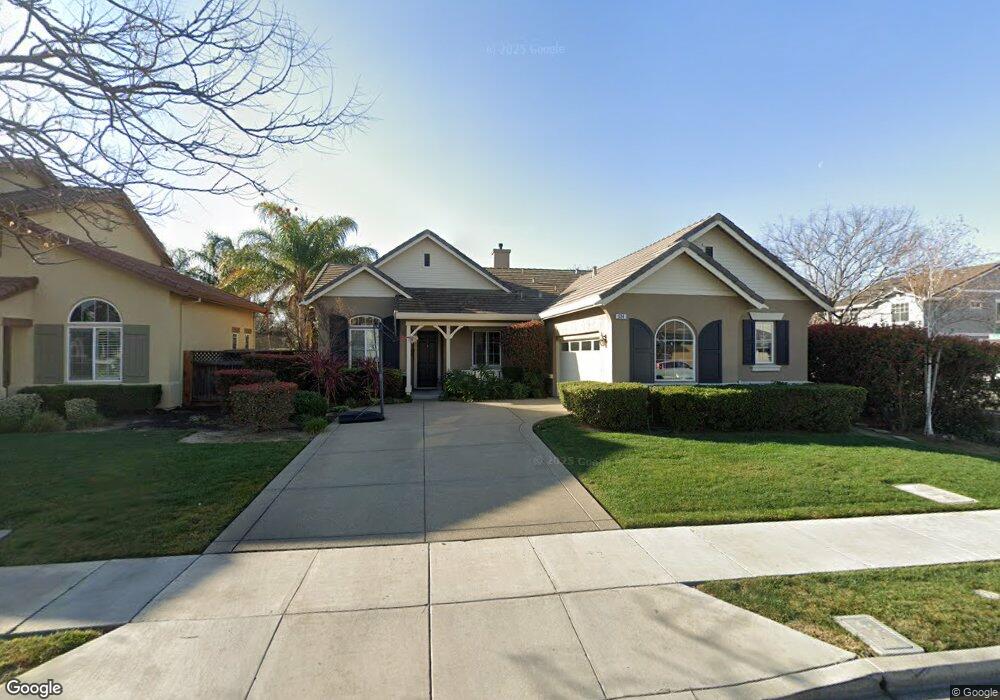
534 Vivian St Brentwood, CA 94513
Brentwood Center NeighborhoodEstimated Value: $716,490 - $771,000
3
Beds
2
Baths
1,938
Sq Ft
$384/Sq Ft
Est. Value
About This Home
This home is located at 534 Vivian St, Brentwood, CA 94513 and is currently estimated at $743,873, approximately $383 per square foot. 534 Vivian St is a home located in Contra Costa County with nearby schools including Mary Casey Black Elementary School, Edna Hill Middle School, and Liberty High School.
Ownership History
Date
Name
Owned For
Owner Type
Purchase Details
Closed on
Oct 25, 2022
Sold by
Gene B Stonebarger B and Gene Ruth L
Bought by
Sandra L Stonebarger Family Trust
Current Estimated Value
Purchase Details
Closed on
Oct 31, 2008
Sold by
Carter Leah
Bought by
Stonebarger Gene B and Fa Ruth J
Purchase Details
Closed on
Mar 17, 2006
Sold by
Carter Robert
Bought by
Carter Leah
Purchase Details
Closed on
Dec 2, 2005
Sold by
Signature At Cedarwood Llc
Bought by
Carter Robert and Carter Leah
Home Financials for this Owner
Home Financials are based on the most recent Mortgage that was taken out on this home.
Original Mortgage
$359,000
Interest Rate
6.5%
Mortgage Type
Fannie Mae Freddie Mac
Create a Home Valuation Report for This Property
The Home Valuation Report is an in-depth analysis detailing your home's value as well as a comparison with similar homes in the area
Home Values in the Area
Average Home Value in this Area
Purchase History
| Date | Buyer | Sale Price | Title Company |
|---|---|---|---|
| Sandra L Stonebarger Family Trust | -- | -- | |
| Stonebarger Gene B | $295,000 | North American Title Company | |
| Carter Leah | -- | North American Title Company | |
| Carter Leah | -- | Chicago Title Co | |
| Carter Robert | $530,500 | Old Republic Title |
Source: Public Records
Mortgage History
| Date | Status | Borrower | Loan Amount |
|---|---|---|---|
| Previous Owner | Carter Robert | $359,000 |
Source: Public Records
Tax History Compared to Growth
Tax History
| Year | Tax Paid | Tax Assessment Tax Assessment Total Assessment is a certain percentage of the fair market value that is determined by local assessors to be the total taxable value of land and additions on the property. | Land | Improvement |
|---|---|---|---|---|
| 2025 | $7,447 | $379,873 | $64,379 | $315,494 |
| 2024 | $7,229 | $372,425 | $63,117 | $309,308 |
| 2023 | $7,229 | $365,124 | $61,880 | $303,244 |
| 2022 | $7,017 | $357,966 | $60,667 | $297,299 |
| 2021 | $6,867 | $350,948 | $59,478 | $291,470 |
| 2019 | $6,841 | $340,541 | $57,715 | $282,826 |
| 2018 | $6,778 | $333,865 | $56,584 | $277,281 |
| 2017 | $6,682 | $327,320 | $55,475 | $271,845 |
| 2016 | $6,357 | $320,903 | $54,388 | $266,515 |
| 2015 | $6,405 | $316,084 | $53,572 | $262,512 |
| 2014 | $6,269 | $309,893 | $52,523 | $257,370 |
Source: Public Records
Map
Nearby Homes