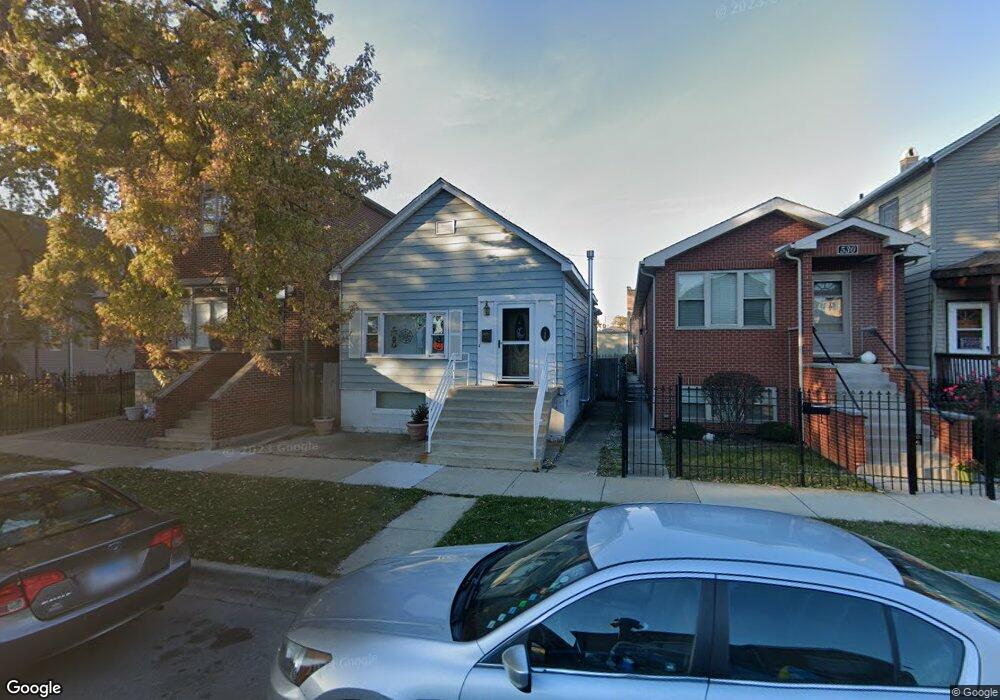
534 W 42nd St Chicago, IL 60609
Bridgeport NeighborhoodEstimated Value: $238,093 - $451,000
2
Beds
1
Bath
660
Sq Ft
$483/Sq Ft
Est. Value
About This Home
This home is located at 534 W 42nd St, Chicago, IL 60609 and is currently estimated at $319,023, approximately $483 per square foot. 534 W 42nd St is a home located in Cook County with nearby schools including Hendricks Elementary Community Academy, St Gabriel Elementary School, and Bridgeport Catholic Academy - South Campus.
Ownership History
Date
Name
Owned For
Owner Type
Purchase Details
Closed on
Jun 16, 2021
Sold by
Gorman John P and Groman John P
Bought by
Miller Patricia K
Current Estimated Value
Home Financials for this Owner
Home Financials are based on the most recent Mortgage that was taken out on this home.
Original Mortgage
$161,000
Interest Rate
4.87%
Mortgage Type
New Conventional
Purchase Details
Closed on
Oct 19, 2007
Sold by
Miller Patricia and Gorman John P
Bought by
Miller Patricia K and Gorman John P
Home Financials for this Owner
Home Financials are based on the most recent Mortgage that was taken out on this home.
Original Mortgage
$192,000
Interest Rate
6.47%
Mortgage Type
New Conventional
Purchase Details
Closed on
Jun 13, 1991
Sold by
Falk Roger
Bought by
Miller Patricia
Home Financials for this Owner
Home Financials are based on the most recent Mortgage that was taken out on this home.
Original Mortgage
$36,800
Interest Rate
10.12%
Create a Home Valuation Report for This Property
The Home Valuation Report is an in-depth analysis detailing your home's value as well as a comparison with similar homes in the area
Home Values in the Area
Average Home Value in this Area
Purchase History
| Date | Buyer | Sale Price | Title Company |
|---|---|---|---|
| Miller Patricia K | -- | Near North Title | |
| Miller Patricia K | -- | None Available | |
| Miller Patricia | $5,000 | -- |
Source: Public Records
Mortgage History
| Date | Status | Borrower | Loan Amount |
|---|---|---|---|
| Previous Owner | Miller Patricia K | $161,000 | |
| Previous Owner | Miller Patricia K | $192,000 | |
| Previous Owner | Miller Patricia | $36,800 |
Source: Public Records
Tax History Compared to Growth
Tax History
| Year | Tax Paid | Tax Assessment Tax Assessment Total Assessment is a certain percentage of the fair market value that is determined by local assessors to be the total taxable value of land and additions on the property. | Land | Improvement |
|---|---|---|---|---|
| 2024 | $2,676 | $16,000 | $2,520 | $13,480 |
| 2023 | $2,587 | $16,000 | $3,150 | $12,850 |
| 2022 | $2,587 | $16,000 | $3,150 | $12,850 |
| 2021 | $2,548 | $16,000 | $3,150 | $12,850 |
| 2020 | $2,463 | $14,160 | $3,150 | $11,010 |
| 2019 | $2,472 | $15,734 | $3,150 | $12,584 |
| 2018 | $2,429 | $15,734 | $3,150 | $12,584 |
| 2017 | $1,893 | $12,169 | $2,835 | $9,334 |
| 2016 | $1,937 | $12,169 | $2,835 | $9,334 |
| 2015 | $1,627 | $12,169 | $2,835 | $9,334 |
| 2014 | $1,507 | $11,711 | $2,677 | $9,034 |
| 2013 | $1,652 | $11,711 | $2,677 | $9,034 |
Source: Public Records
Map
Nearby Homes
- 604 W 43rd St
- 4217 S Emerald Ave
- 4407 S Wallace St
- 4411 S Wallace St
- 4419 S Wallace St
- 520 W 44th Place
- 4243 S Princeton Ave
- 4425 S Union Ave
- 4353 S Halsted St
- 4204 S Wentworth Ave
- 3824 S Normal Ave
- 4452 S Shields Ave
- 4438 S Princeton Ave
- 3812 S Wallace St
- 455 W 38th St
- 3830 S Emerald Ave
- 4451 S Princeton Ave
- 4361 S Halsted St
- 3606 S Halsted St
- 3727 S Lowe Ave