5340 Paris Ct Unit NV Reno, NV 89511
Summit Sierra NeighborhoodEstimated Value: $1,606,000 - $1,963,000
4
Beds
4
Baths
3,445
Sq Ft
$516/Sq Ft
Est. Value
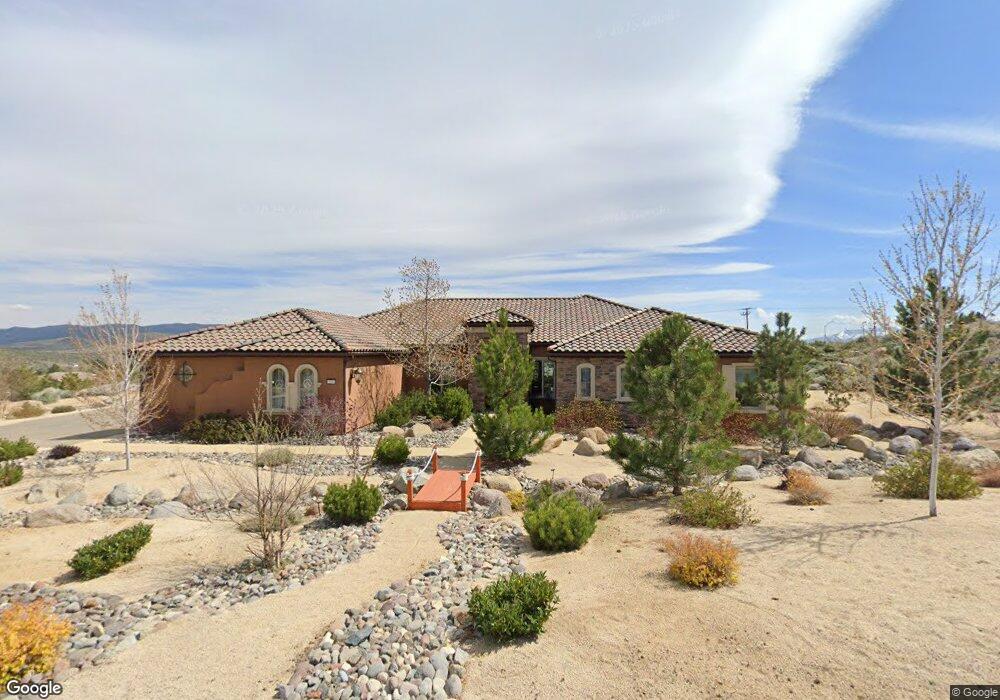
About This Home
This home is located at 5340 Paris Ct Unit NV, Reno, NV 89511 and is currently estimated at $1,777,751, approximately $516 per square foot. 5340 Paris Ct Unit NV is a home located in Washoe County with nearby schools including Ted Hunsburger Elementary School, Marce Herz Middle School, and Galena High School.
Ownership History
Date
Name
Owned For
Owner Type
Purchase Details
Closed on
Feb 22, 2018
Sold by
Wofford William A and Wofford Kristen L
Bought by
Taylor Thomas A and Taylor Elaine C
Current Estimated Value
Purchase Details
Closed on
Mar 19, 2013
Sold by
Tl Mt Rose Estates Lp
Bought by
Wofford William A and Wofford Kristen L
Home Financials for this Owner
Home Financials are based on the most recent Mortgage that was taken out on this home.
Original Mortgage
$407,400
Interest Rate
3.49%
Mortgage Type
New Conventional
Purchase Details
Closed on
Dec 26, 2008
Sold by
Colonial Bank
Bought by
Tl Mt Rose Estates Lp
Purchase Details
Closed on
Dec 24, 2008
Sold by
Reynen & Bardis Mt Rose Estates Llc
Bought by
Colonial Bank Na
Create a Home Valuation Report for This Property
The Home Valuation Report is an in-depth analysis detailing your home's value as well as a comparison with similar homes in the area
Home Values in the Area
Average Home Value in this Area
Purchase History
| Date | Buyer | Sale Price | Title Company |
|---|---|---|---|
| Taylor Thomas A | $937,000 | First Centennial Reno | |
| Wofford William A | $679,000 | First American Title Sparks | |
| Tl Mt Rose Estates Lp | $4,050,000 | First American Title Reno | |
| Colonial Bank Na | $4,700,000 | First American Title Paseo V |
Source: Public Records
Mortgage History
| Date | Status | Borrower | Loan Amount |
|---|---|---|---|
| Previous Owner | Wofford William A | $407,400 |
Source: Public Records
Tax History
| Year | Tax Paid | Tax Assessment Tax Assessment Total Assessment is a certain percentage of the fair market value that is determined by local assessors to be the total taxable value of land and additions on the property. | Land | Improvement |
|---|---|---|---|---|
| 2026 | $6,038 | $374,843 | $107,993 | $266,851 |
| 2024 | $7,594 | $373,596 | $102,375 | $271,221 |
| 2023 | $7,594 | $363,267 | $108,171 | $255,096 |
| 2022 | $7,373 | $306,322 | $94,374 | $211,948 |
| 2021 | $7,159 | $288,500 | $78,656 | $209,844 |
| 2020 | $6,949 | $273,713 | $68,072 | $205,641 |
| 2019 | $6,750 | $264,758 | $68,072 | $196,686 |
| 2018 | $6,561 | $239,423 | $47,439 | $191,984 |
| 2017 | $6,355 | $234,851 | $43,250 | $191,601 |
| 2016 | $6,194 | $235,939 | $40,698 | $195,241 |
| 2015 | $6,178 | $232,329 | $37,895 | $194,434 |
| 2014 | $5,986 | $218,485 | $33,800 | $184,685 |
| 2013 | -- | $179,723 | $24,570 | $155,153 |
Source: Public Records
Map
Nearby Homes
- 5745 Carl Dr
- 5452 Salmon River Ct
- 11026 Copper Rock Trail Unit Ascente 56
- 11026 Copper Rock Trail
- 15245 Callahan Rd
- 15155 Legend Trail
- 15185 Legend Trail
- Hendrix Edge Plan at Ascente - Silverskye Collection
- Hendrix Plan at Ascente - Silverskye Collection
- Axl Air Plan at Ascente - Silverskye Collection
- Royce Elite Plan at Ascente - Copper Rock Collection
- Axl Max Plan at Ascente - Silverskye Collection
- Axl Edge Plan at Ascente - Silverskye Collection
- Brunello Plan at Ascente - Copper Rock Collection
- Axl Plan at Ascente - Silverskye Collection
- Hendrix Max Plan at Ascente - Silverskye Collection
- Hendrix Air Plan at Ascente - Silverskye Collection
- Royce Plan at Ascente - Copper Rock Collection
- Brunello Elite Plan at Ascente - Copper Rock Collection
- 13275 W Saddlebow Dr
- 5340 Paris Ct
- 5340 Paris Ct Unit Lot 358
- 5360 Paris Ct Unit Lot 359
- 5320 Paris Ct
- 5320 Paris Ct Unit Lot 357
- 5345 Paris Ct
- 5365 Paris Ct
- 5365 Paris Ct Unit Lot 345
- 5325 Paris Ct
- 5325 Paris Ct Unit Lot 347
- 5300 Paris Ct
- 5300 Paris Ct Unit Lot 356
- 5305 Paris Ct
- 5305 Paris Ct Unit Lot 348
- 5405 Paris Ave
- 5405 Paris Ave Unit Lot 344
- 5325 Cognac Ct
- 5285 Paris Ct
- 5260 Paris Ct
- 5260 Paris Ct Unit Lot 355
Your Personal Tour Guide
Ask me questions while you tour the home.