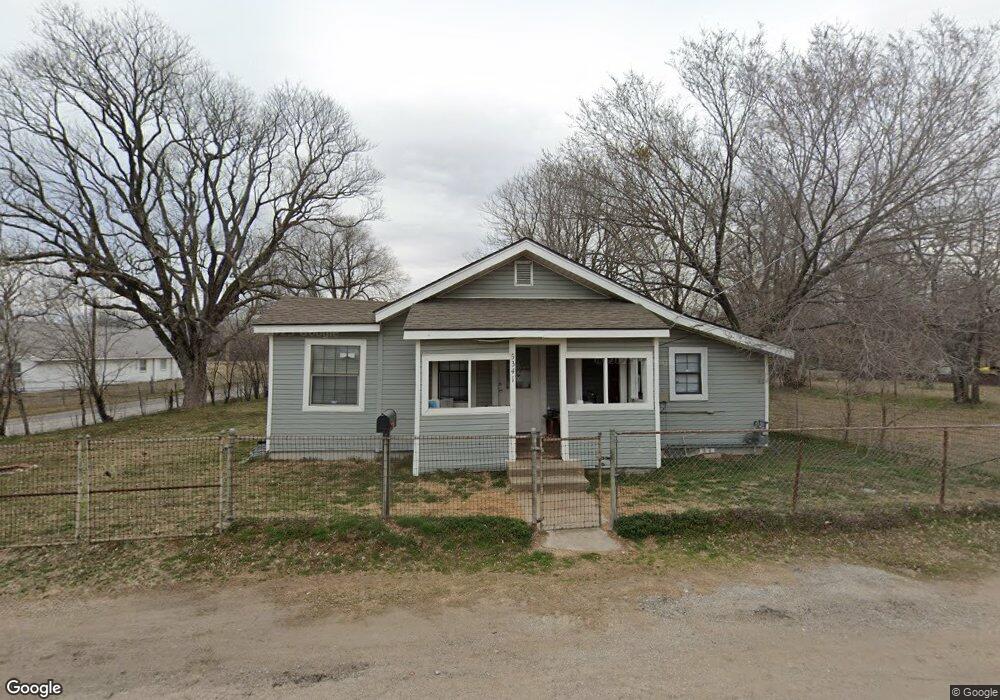
5341 W 11th St Tulsa, OK 74127
Charles Page NeighborhoodEstimated Value: $74,000 - $91,000
2
Beds
1
Bath
924
Sq Ft
$89/Sq Ft
Est. Value
About This Home
This home is located at 5341 W 11th St, Tulsa, OK 74127 and is currently estimated at $82,432, approximately $89 per square foot. 5341 W 11th St is a home located in Tulsa County with nearby schools including Wayman Tisdale Fine Arts Academy, Central Middle School, and Central Junior High School.
Ownership History
Date
Name
Owned For
Owner Type
Purchase Details
Closed on
Feb 2, 2022
Sold by
West 11Th Street 5341 Land Trust
Bought by
Mrmd Properties Llc
Current Estimated Value
Home Financials for this Owner
Home Financials are based on the most recent Mortgage that was taken out on this home.
Original Mortgage
$48,656
Interest Rate
4.16%
Mortgage Type
New Conventional
Purchase Details
Closed on
Apr 10, 2017
Sold by
Oakley Properties Llc
Bought by
West 11Th Street 5341 Land Trust
Purchase Details
Closed on
Jun 14, 2016
Sold by
County Of Tulsa
Bought by
Oakley Properties Llc
Purchase Details
Closed on
May 10, 2004
Sold by
National City Home Loan Services Inc
Bought by
Roberts Albert M
Purchase Details
Closed on
Mar 31, 2004
Sold by
Winford Jimmy and Winford Sheila
Bought by
National City Homes Loan Services Inc and Altegra Credit Co
Create a Home Valuation Report for This Property
The Home Valuation Report is an in-depth analysis detailing your home's value as well as a comparison with similar homes in the area
Home Values in the Area
Average Home Value in this Area
Purchase History
| Date | Buyer | Sale Price | Title Company |
|---|---|---|---|
| Mrmd Properties Llc | -- | Apex Title | |
| West 11Th Street 5341 Land Trust | -- | None Available | |
| Oakley Properties Llc | $9,500 | None Available | |
| Roberts Albert M | $23,000 | -- | |
| National City Homes Loan Services Inc | -- | -- |
Source: Public Records
Mortgage History
| Date | Status | Borrower | Loan Amount |
|---|---|---|---|
| Previous Owner | Mrmd Properties Llc | $48,656 |
Source: Public Records
Tax History Compared to Growth
Tax History
| Year | Tax Paid | Tax Assessment Tax Assessment Total Assessment is a certain percentage of the fair market value that is determined by local assessors to be the total taxable value of land and additions on the property. | Land | Improvement |
|---|---|---|---|---|
| 2024 | $1,140 | $4,490 | $875 | $3,615 |
| 2023 | $570 | $4,490 | $875 | $3,615 |
| 2022 | $39 | $4,042 | $866 | $3,176 |
| 2021 | $43 | $3,850 | $825 | $3,025 |
| 2020 | $502 | $3,850 | $825 | $3,025 |
| 2019 | $528 | $3,850 | $825 | $3,025 |
| 2018 | $529 | $3,850 | $825 | $3,025 |
| 2017 | $439 | $2,970 | $781 | $2,189 |
| 2016 | $436 | $3,025 | $781 | $2,244 |
| 2015 | $443 | $3,025 | $781 | $2,244 |
| 2014 | $439 | $3,025 | $781 | $2,244 |
Source: Public Records
Map
Nearby Homes
- 1126 S 53rd West Ave
- 5112 W 10th St
- 1120 S 51st West Ave
- 5134 Charles Page Blvd
- 5128 Charles Page Blvd
- 5909 W 10th St
- 4920 Charles Page Blvd
- 4732 W 8th St
- 422 S 49th West Ave
- 429 S 49th West Ave
- 5677 W 3rd St
- 5779 W 2nd St
- 5330 W 2nd St
- 4933 W 2nd St
- 425 S 45th West Ave
- 343 S 46th West Ave
- 4947 W 1st St
- 444 S 43rd West Ave
- 323 S 45th West Ave
- 4449 W 1st St
- 1028 S 54th West Ave
- 5323 W 11th St
- 5336 W 11th St
- 5340 W 11th St
- 5330 W 11th St
- 5404 W 11th St
- 5326 W 11th St
- 5421 W 11th St
- 1011 S 54th West Ave
- 1003 S 54th West Ave
- 1104 S 53rd West Ave
- 5412 W 11th St
- 5311 W 11th St
- 5321 W 11th Place
- 5325 W 11th Place
- 1108 S 53rd West Ave
- 5315 W 11th Place
- 5329 W 11th Place
- 5418 W 11th St
- 5311 W 11th Place