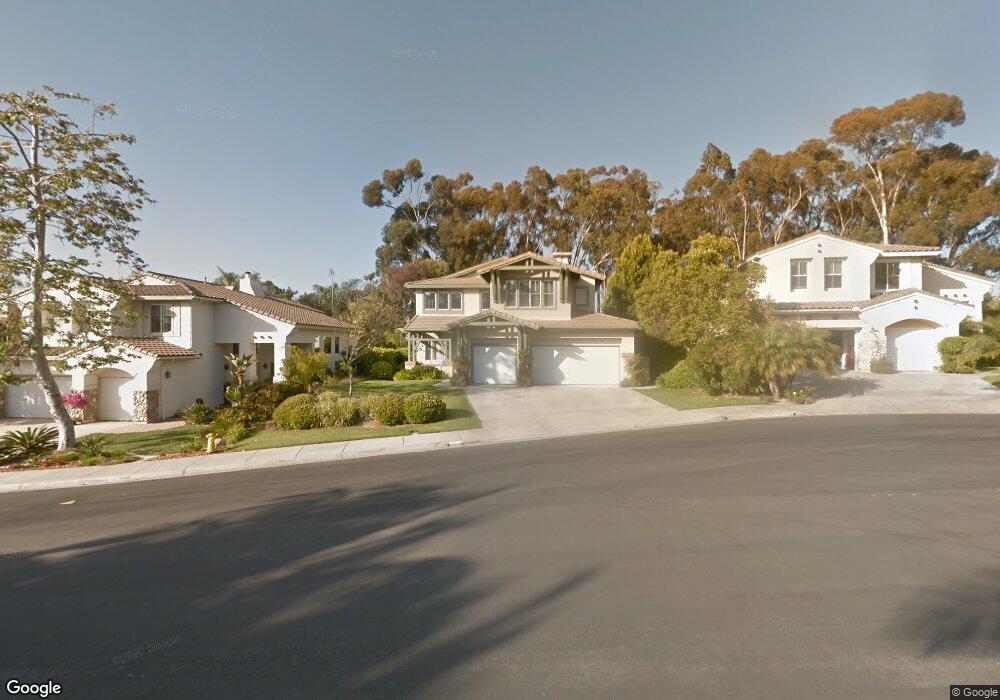
5342 Forecastle Ct Carlsbad, CA 92008
Kelly Ranch NeighborhoodEstimated Value: $1,775,030 - $1,889,000
5
Beds
4
Baths
2,818
Sq Ft
$646/Sq Ft
Est. Value
About This Home
This home is located at 5342 Forecastle Ct, Carlsbad, CA 92008 and is currently estimated at $1,821,008, approximately $646 per square foot. 5342 Forecastle Ct is a home located in San Diego County with nearby schools including Kelly Elementary School, Sage Creek High, and Carlsbad High School.
Ownership History
Date
Name
Owned For
Owner Type
Purchase Details
Closed on
Jun 3, 1997
Sold by
Horton D R San Diego No 15 Inc
Bought by
Sweeney William K and Sweeney Jo Ann
Current Estimated Value
Home Financials for this Owner
Home Financials are based on the most recent Mortgage that was taken out on this home.
Original Mortgage
$240,000
Outstanding Balance
$33,664
Interest Rate
7.75%
Estimated Equity
$1,787,344
Purchase Details
Closed on
Oct 9, 1996
Sold by
D R Horton San Diego #15 Inc
Bought by
Foltz William R and Foltz Frances M
Home Financials for this Owner
Home Financials are based on the most recent Mortgage that was taken out on this home.
Original Mortgage
$248,800
Interest Rate
7.88%
Create a Home Valuation Report for This Property
The Home Valuation Report is an in-depth analysis detailing your home's value as well as a comparison with similar homes in the area
Home Values in the Area
Average Home Value in this Area
Purchase History
| Date | Buyer | Sale Price | Title Company |
|---|---|---|---|
| Sweeney William K | $310,000 | Chicago Title Co | |
| Foltz William R | $311,000 | Chicago Title Co |
Source: Public Records
Mortgage History
| Date | Status | Borrower | Loan Amount |
|---|---|---|---|
| Open | Sweeney William K | $240,000 | |
| Previous Owner | Foltz William R | $248,800 |
Source: Public Records
Tax History Compared to Growth
Tax History
| Year | Tax Paid | Tax Assessment Tax Assessment Total Assessment is a certain percentage of the fair market value that is determined by local assessors to be the total taxable value of land and additions on the property. | Land | Improvement |
|---|---|---|---|---|
| 2025 | $5,253 | $504,853 | $162,856 | $341,997 |
| 2024 | $5,253 | $494,955 | $159,663 | $335,292 |
| 2023 | $5,224 | $485,251 | $156,533 | $328,718 |
| 2022 | $5,142 | $475,737 | $153,464 | $322,273 |
| 2021 | $5,103 | $466,409 | $150,455 | $315,954 |
| 2020 | $5,068 | $461,628 | $148,913 | $312,715 |
| 2019 | $4,975 | $452,578 | $145,994 | $306,584 |
| 2018 | $4,765 | $443,705 | $143,132 | $300,573 |
| 2017 | $4,684 | $435,006 | $140,326 | $294,680 |
| 2016 | $4,495 | $426,477 | $137,575 | $288,902 |
| 2015 | $4,476 | $420,072 | $135,509 | $284,563 |
| 2014 | $4,401 | $411,844 | $132,855 | $278,989 |
Source: Public Records
Map
Nearby Homes
- 5420 Kipling Ln
- 2289 Bryant Dr
- 2273 Masters Rd
- 5423 Foxtail Loop
- 3438 Don Alberto Dr Unit 434
- 3466 Don Lorenzo Dr Unit 324
- 5115 Don Miguel Dr Unit 165
- 3462 Don Alberto Dr
- 3514 Don Juan Dr
- 3438 Don Ortega Dr
- 3445 Don Ortega Dr
- 5132 Don Rodolfo Dr
- 5459 Don Felipe Dr Unit 485
- 3473 Don Ortega Dr
- 5077 Ashberry Rd
- 3737 Bergen Peak Place
- 3619 N Fork Ave
- 5146 Delaney Ct
- 3461 Alander Ct
- 2336 Summerwind Place
- 5338 Forecastle Ct
- 5348 Forecastle Ct
- 5332 Forecastle Ct
- 5352 Forecastle Ct
- 2305 Lanyard Place
- 5353 Forecastle Ct
- 5328 Forecastle Ct
- 5341 Forecastle Ct
- 5345 Forecastle Ct
- 5337 Forecastle Ct
- 2309 Lanyard Place
- 5349 Forecastle Ct
- 5333 Forecastle Ct
- 5329 Forecastle Ct
- 5324 Forecastle Ct
- 5469 Reef Cir
- 5401 Reef Cir
- 5325 Forecastle Ct
- 2302 Lanyard Place
- 5320 Forecastle Ct