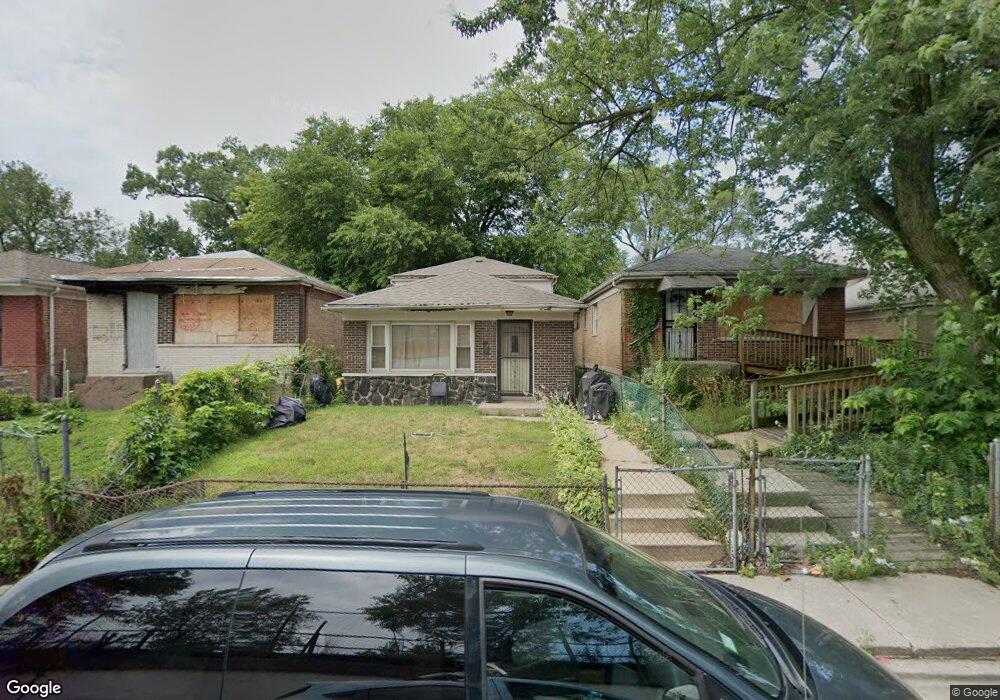
5342 S Wallace St Chicago, IL 60609
Back of the Yards NeighborhoodEstimated Value: $157,000 - $216,000
6
Beds
2
Baths
1,000
Sq Ft
$172/Sq Ft
Est. Value
About This Home
This home is located at 5342 S Wallace St, Chicago, IL 60609 and is currently estimated at $172,324, approximately $172 per square foot. 5342 S Wallace St is a home located in Cook County with nearby schools including Dewey Elementary Academy Of Fine Arts, KIPP Bloom Charter Elementary School, and Visitation Catholic School.
Ownership History
Date
Name
Owned For
Owner Type
Purchase Details
Closed on
Nov 16, 2001
Sold by
Bowen Marion and Wertymer John
Bought by
Morris Ross Cedric and Morris Ross Shaunte C
Current Estimated Value
Purchase Details
Closed on
Apr 17, 2001
Sold by
The Bank Of New York
Bought by
Bowen Marion and Wertymer John
Purchase Details
Closed on
Mar 10, 2000
Sold by
Burton Zerrick
Bought by
The Bank Of New York
Purchase Details
Closed on
Feb 20, 1998
Sold by
Davis Roland
Bought by
Burton Zerrick
Home Financials for this Owner
Home Financials are based on the most recent Mortgage that was taken out on this home.
Original Mortgage
$56,100
Interest Rate
11.75%
Purchase Details
Closed on
Oct 21, 1997
Sold by
Harmata Jozef
Bought by
Davis Roland
Home Financials for this Owner
Home Financials are based on the most recent Mortgage that was taken out on this home.
Original Mortgage
$49,500
Interest Rate
8.5%
Mortgage Type
Balloon
Purchase Details
Closed on
Jun 10, 1995
Sold by
Walkosz John
Bought by
Harmata Jozef
Create a Home Valuation Report for This Property
The Home Valuation Report is an in-depth analysis detailing your home's value as well as a comparison with similar homes in the area
Home Values in the Area
Average Home Value in this Area
Purchase History
| Date | Buyer | Sale Price | Title Company |
|---|---|---|---|
| Morris Ross Cedric | $80,000 | -- | |
| Bowen Marion | $28,500 | -- | |
| The Bank Of New York | -- | -- | |
| Burton Zerrick | $54,000 | Lawyers Title Insurance Corp | |
| Davis Roland | $30,000 | Lawyers Title Insurance Corp | |
| Harmata Jozef | $10,000 | -- |
Source: Public Records
Mortgage History
| Date | Status | Borrower | Loan Amount |
|---|---|---|---|
| Previous Owner | Burton Zerrick | $56,100 | |
| Previous Owner | Davis Roland | $49,500 | |
| Closed | Morris Ross Cedric | $0 |
Source: Public Records
Tax History
| Year | Tax Paid | Tax Assessment Tax Assessment Total Assessment is a certain percentage of the fair market value that is determined by local assessors to be the total taxable value of land and additions on the property. | Land | Improvement |
|---|---|---|---|---|
| 2025 | $1,160 | $8,200 | $943 | $7,257 |
| 2024 | $1,160 | $8,200 | $943 | $7,257 |
| 2023 | $1,131 | $5,500 | $2,044 | $3,456 |
| 2022 | $1,131 | $5,500 | $2,044 | $3,456 |
| 2021 | $1,106 | $5,499 | $2,043 | $3,456 |
| 2020 | $2,850 | $12,793 | $2,043 | $10,750 |
| 2019 | $2,856 | $14,215 | $2,043 | $12,172 |
| 2018 | $2,808 | $14,215 | $2,043 | $12,172 |
| 2017 | $2,458 | $11,417 | $1,886 | $9,531 |
| 2016 | $2,287 | $11,417 | $1,886 | $9,531 |
| 2015 | $2,092 | $11,417 | $1,886 | $9,531 |
| 2014 | $1,947 | $10,494 | $1,729 | $8,765 |
| 2013 | $1,909 | $10,494 | $1,729 | $8,765 |
Source: Public Records
Map
Nearby Homes
- 5315 S Lowe Ave
- 5330 S Union Ave
- 643 W 54th Place
- 652 W Garfield Blvd
- 5219 S Halsted St
- 5215 S Halsted St
- 817 W 54th St
- 5129 S Emerald Ave
- 848 W 53rd St
- 5624 S Lowe Ave
- 5300 S Peoria St
- 5302 S Peoria St
- 738 W 51st St
- 5238 S Princeton Ave
- 5214 S Princeton Ave
- 5210 S Princeton Ave
- 5552 S Shields Ave
- 311 W Garfield Blvd
- 1050 W 57th St
- 850 W 51st Place
- 5340 S Wallace St
- 5344 S Wallace St
- 5346 S Wallace St
- 5336 S Wallace St
- 5334 S Wallace St
- 5350 S Wallace St
- 5352 S Wallace St
- 5332 S Wallace St
- 5354 S Wallace St
- 5343 S Lowe Ave
- 5326 S Wallace St
- 5358 S Wallace St
- 5324 S Wallace St
- 5329 S Lowe Ave
- 5355 S Lowe Ave
- 5351 S Lowe Ave
- 5349 S Lowe Ave
- 5322 S Wallace St
- 5327 S Lowe Ave
Your Personal Tour Guide
Ask me questions while you tour the home.