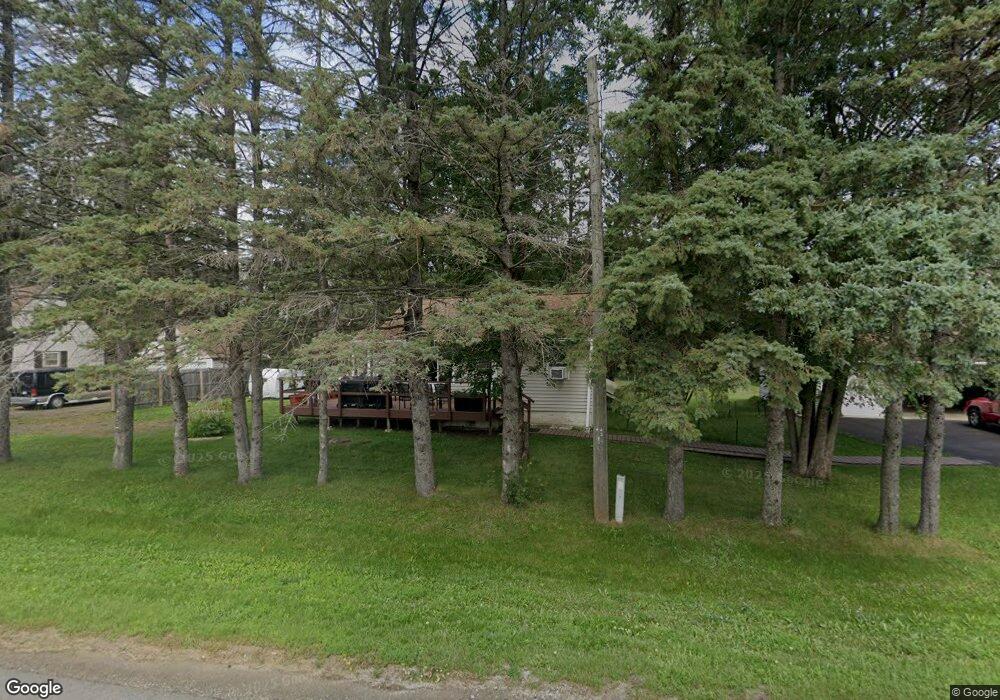
5343 McNiven Rd Chisholm, MN 55719
Estimated Value: $118,686 - $170,000
2
Beds
1
Bath
720
Sq Ft
$199/Sq Ft
Est. Value
About This Home
This home is located at 5343 McNiven Rd, Chisholm, MN 55719 and is currently estimated at $142,922, approximately $198 per square foot. 5343 McNiven Rd is a home located in St. Louis County with nearby schools including Vaughan Elementary School, Chisholm Elementary School, and Chisholm Secondary School.
Ownership History
Date
Name
Owned For
Owner Type
Purchase Details
Closed on
Jun 12, 2018
Sold by
Larson Matthew Matthew
Bought by
Holappa David David and Holappa Marie Marie
Current Estimated Value
Home Financials for this Owner
Home Financials are based on the most recent Mortgage that was taken out on this home.
Original Mortgage
$74,949
Outstanding Balance
$64,682
Interest Rate
4.5%
Mortgage Type
New Conventional
Estimated Equity
$78,240
Purchase Details
Closed on
Aug 27, 2004
Sold by
Backman Sophia
Bought by
Larson Matthew C and Larson Brooke R
Home Financials for this Owner
Home Financials are based on the most recent Mortgage that was taken out on this home.
Original Mortgage
$57,475
Interest Rate
5.93%
Mortgage Type
Unknown
Purchase Details
Closed on
Apr 30, 2002
Sold by
Henney Billy Jack and Henney Christine C
Bought by
Backman Sophia
Home Financials for this Owner
Home Financials are based on the most recent Mortgage that was taken out on this home.
Original Mortgage
$35,000
Interest Rate
7.16%
Create a Home Valuation Report for This Property
The Home Valuation Report is an in-depth analysis detailing your home's value as well as a comparison with similar homes in the area
Home Values in the Area
Average Home Value in this Area
Purchase History
| Date | Buyer | Sale Price | Title Company |
|---|---|---|---|
| Holappa David David | $74,200 | -- | |
| Holappa David L | $74,200 | Sellman Title Company Llc | |
| Larson Matthew C | $60,500 | -- | |
| Backman Sophia | $54,400 | -- |
Source: Public Records
Mortgage History
| Date | Status | Borrower | Loan Amount |
|---|---|---|---|
| Open | Holappa David L | $74,949 | |
| Closed | Holappa David David | $74,200 | |
| Previous Owner | Larson Matthew C | $57,475 | |
| Previous Owner | Backman Sophia | $35,000 |
Source: Public Records
Tax History Compared to Growth
Tax History
| Year | Tax Paid | Tax Assessment Tax Assessment Total Assessment is a certain percentage of the fair market value that is determined by local assessors to be the total taxable value of land and additions on the property. | Land | Improvement |
|---|---|---|---|---|
| 2024 | $954 | $110,400 | $4,100 | $106,300 |
| 2023 | $954 | $101,900 | $3,800 | $98,100 |
| 2022 | $472 | $84,100 | $3,200 | $80,900 |
| 2021 | $488 | $71,300 | $2,100 | $69,200 |
| 2020 | $410 | $67,400 | $2,100 | $65,300 |
| 2019 | $426 | $64,400 | $2,100 | $62,300 |
| 2018 | $1,096 | $64,400 | $2,100 | $62,300 |
| 2017 | $1,134 | $64,400 | $2,100 | $62,300 |
| 2016 | $1,294 | $67,300 | $16,800 | $50,500 |
| 2015 | $1,249 | $66,000 | $16,800 | $49,200 |
| 2014 | $1,249 | $63,200 | $16,800 | $46,400 |
Source: Public Records
Map
Nearby Homes
- 5337 McNiven Rd
- 100 13th St NW
- 5349 McNiven Rd
- 5325 McNiven Rd
- 30 13th St NW
- 109 13th St NW
- 105 13th St NW
- 1221 1st Ave NW
- 26 13th St NW
- 1219 2nd Ave NW
- 1219 2nd Ave NW
- 1220 1st Ave NW
- 1321 2nd Ave NW
- 1415 1st Ave NW
- 20 13th St NW
- 110 12th St NW
- 23 13th St NW
- 104 12th St NW
- 1201 1st Ave NW
- 120 12th St NW