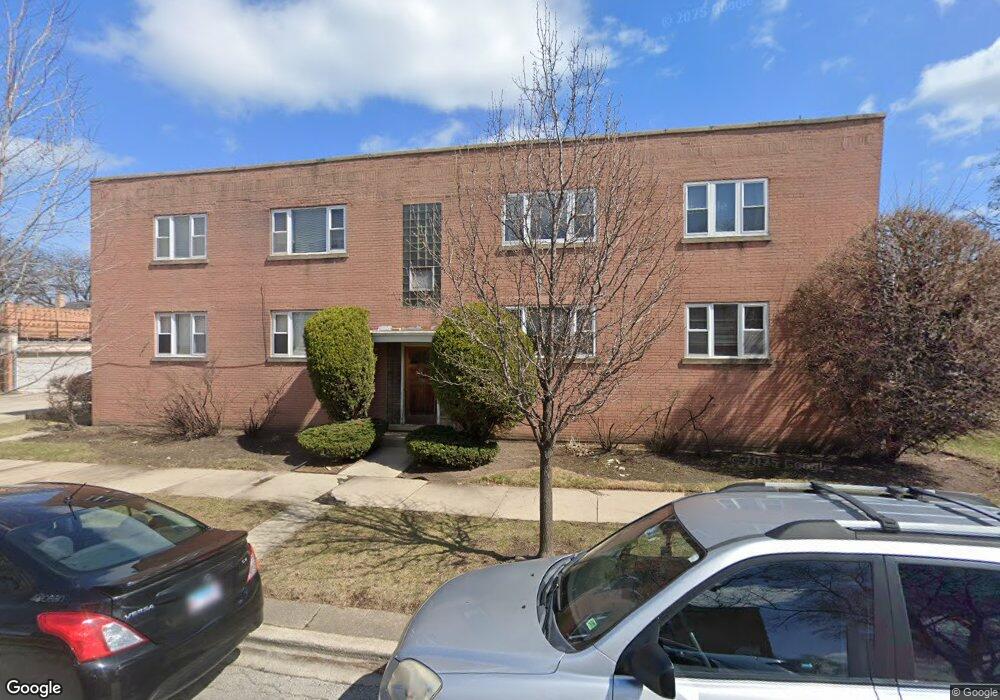
5343 N Rockwell St Unit 2S Chicago, IL 60625
Lincoln Square NeighborhoodEstimated Value: $218,000 - $273,000
--
Bed
--
Bath
6,600
Sq Ft
$36/Sq Ft
Est. Value
About This Home
This home is located at 5343 N Rockwell St Unit 2S, Chicago, IL 60625 and is currently estimated at $240,267, approximately $36 per square foot. 5343 N Rockwell St Unit 2S is a home located in Cook County with nearby schools including Jamieson Elementary School, Mather High School, and North Shore Adventist Academy.
Ownership History
Date
Name
Owned For
Owner Type
Purchase Details
Closed on
Mar 3, 2000
Sold by
Politis Andy
Bought by
Hatzis Vasilios
Current Estimated Value
Home Financials for this Owner
Home Financials are based on the most recent Mortgage that was taken out on this home.
Original Mortgage
$84,000
Outstanding Balance
$28,407
Interest Rate
8.26%
Estimated Equity
$211,860
Purchase Details
Closed on
Jul 17, 1997
Sold by
Duraku Muho and Duraku Natidze
Bought by
Politis Andrew J
Home Financials for this Owner
Home Financials are based on the most recent Mortgage that was taken out on this home.
Original Mortgage
$76,000
Interest Rate
6.12%
Purchase Details
Closed on
Dec 4, 1992
Sold by
Fornell Evelyn B
Bought by
Duraku Muho and Duraku Hatidez
Home Financials for this Owner
Home Financials are based on the most recent Mortgage that was taken out on this home.
Original Mortgage
$57,000
Interest Rate
7.26%
Create a Home Valuation Report for This Property
The Home Valuation Report is an in-depth analysis detailing your home's value as well as a comparison with similar homes in the area
Home Values in the Area
Average Home Value in this Area
Purchase History
| Date | Buyer | Sale Price | Title Company |
|---|---|---|---|
| Hatzis Vasilios | $114,000 | -- | |
| Politis Andrew J | $96,500 | -- | |
| Duraku Muho | -- | Land Title |
Source: Public Records
Mortgage History
| Date | Status | Borrower | Loan Amount |
|---|---|---|---|
| Open | Hatzis Vasilios | $84,000 | |
| Previous Owner | Politis Andrew J | $76,000 | |
| Previous Owner | Duraku Muho | $57,000 |
Source: Public Records
Tax History Compared to Growth
Tax History
| Year | Tax Paid | Tax Assessment Tax Assessment Total Assessment is a certain percentage of the fair market value that is determined by local assessors to be the total taxable value of land and additions on the property. | Land | Improvement |
|---|---|---|---|---|
| 2024 | $2,887 | $13,691 | $6,678 | $7,013 |
| 2023 | $2,793 | $17,000 | $5,410 | $11,590 |
| 2022 | $2,793 | $17,000 | $5,410 | $11,590 |
| 2021 | $2,749 | $16,999 | $5,409 | $11,590 |
| 2020 | $2,817 | $15,749 | $3,211 | $12,538 |
| 2019 | $2,833 | $17,528 | $3,211 | $14,317 |
| 2018 | $2,784 | $17,528 | $3,211 | $14,317 |
| 2017 | $3,040 | $17,495 | $2,873 | $14,622 |
| 2016 | $3,004 | $17,495 | $2,873 | $14,622 |
| 2015 | $2,725 | $17,495 | $2,873 | $14,622 |
| 2014 | $2,527 | $16,186 | $2,535 | $13,651 |
| 2013 | $2,466 | $16,186 | $2,535 | $13,651 |
Source: Public Records
Map
Nearby Homes
- 5300 N Lincoln Ave Unit 4E
- 2531 W Berwyn Ave Unit G
- 2710 W Summerdale Ave Unit GA
- 2700 W Balmoral Ave
- 5250 N Lincoln Ave Unit 3C
- 2712 W Balmoral Ave Unit 2E
- 5220 N Rockwell St Unit 1S
- 2521 W Farragut Ave
- 2637 W Catalpa Ave
- 2620 W Catalpa Ave Unit 1A
- 2626 W Catalpa Ave Unit 21
- 5230 N Campbell Ave Unit 1B
- 2409 W Balmoral Ave Unit 3D
- 2422 W Berwyn Ave Unit 309
- 2411 W Balmoral Ave Unit 1F
- 2434 W Farragut Ave Unit 3B
- 2745 W Berwyn Ave
- 2601 W Foster Ave Unit 3S
- 5439 N Artesian Ave
- 2420 W Farragut Ave Unit 3A
- 5343 N Rockwell St Unit 1S
- 5343 N Rockwell St Unit 2N
- 5343 N Rockwell St Unit 1N
- 2552 W Summerdale Ave Unit 2
- 2548 W Summerdale Ave Unit 2
- 2548 W Summerdale Ave
- 5340 N Rockwell St Unit 1N
- 2542 W Summerdale Ave
- 2542 W Summerdale Ave Unit 2542-G
- 2542 W Summerdale Ave Unit 2546-1R
- 2542 W Summerdale Ave Unit 2542-2F
- 2557 W Balmoral Ave
- 2553 W Balmoral Ave
- 2606 W Summerdale Ave
- 2551 W Balmoral Ave
- 2540 W Summerdale Ave
- 5323 N Rockwell St Unit GS
- 5323 N Rockwell St Unit 2N
- 5323 N Rockwell St Unit 302
- 5323 N Rockwell St Unit 201