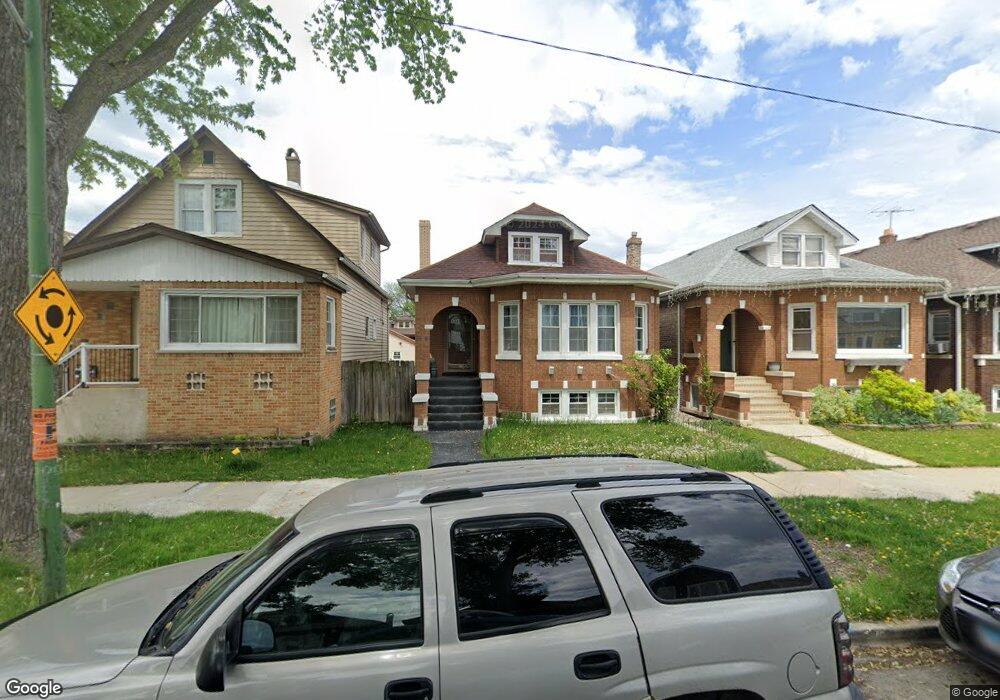
5344 W Wellington Ave Chicago, IL 60641
Cragin NeighborhoodEstimated Value: $327,000 - $407,701
3
Beds
1
Bath
1,193
Sq Ft
$309/Sq Ft
Est. Value
About This Home
This home is located at 5344 W Wellington Ave, Chicago, IL 60641 and is currently estimated at $368,175, approximately $308 per square foot. 5344 W Wellington Ave is a home located in Cook County with nearby schools including Camras Elementary School, Foreman College and Career Academy, and Horizon Science Academy-Belmont.
Ownership History
Date
Name
Owned For
Owner Type
Purchase Details
Closed on
Sep 23, 2004
Sold by
Vilchez Gerardo
Bought by
Vilchez Gerardo and Vilchez Cristina
Current Estimated Value
Home Financials for this Owner
Home Financials are based on the most recent Mortgage that was taken out on this home.
Original Mortgage
$248,000
Outstanding Balance
$123,275
Interest Rate
5.93%
Mortgage Type
New Conventional
Estimated Equity
$244,900
Purchase Details
Closed on
Jul 20, 2001
Sold by
Nunez Ramon and Cruz Mireya
Bought by
Vilchez Gerardo
Home Financials for this Owner
Home Financials are based on the most recent Mortgage that was taken out on this home.
Original Mortgage
$223,295
Interest Rate
7.14%
Mortgage Type
FHA
Purchase Details
Closed on
Oct 30, 1995
Sold by
Capitol Bank & Trust
Bought by
Nunez Ramon and Cruz Mireya
Home Financials for this Owner
Home Financials are based on the most recent Mortgage that was taken out on this home.
Original Mortgage
$110,000
Interest Rate
7.65%
Create a Home Valuation Report for This Property
The Home Valuation Report is an in-depth analysis detailing your home's value as well as a comparison with similar homes in the area
Home Values in the Area
Average Home Value in this Area
Purchase History
| Date | Buyer | Sale Price | Title Company |
|---|---|---|---|
| Vilchez Gerardo | -- | Law Title | |
| Vilchez Gerardo | $227,000 | -- | |
| Nunez Ramon | $125,000 | -- |
Source: Public Records
Mortgage History
| Date | Status | Borrower | Loan Amount |
|---|---|---|---|
| Open | Vilchez Gerardo | $248,000 | |
| Closed | Vilchez Gerardo | $223,295 | |
| Previous Owner | Nunez Ramon | $110,000 |
Source: Public Records
Tax History Compared to Growth
Tax History
| Year | Tax Paid | Tax Assessment Tax Assessment Total Assessment is a certain percentage of the fair market value that is determined by local assessors to be the total taxable value of land and additions on the property. | Land | Improvement |
|---|---|---|---|---|
| 2024 | $5,423 | $32,001 | $6,938 | $25,063 |
| 2023 | $5,265 | $29,000 | $5,625 | $23,375 |
| 2022 | $5,265 | $29,000 | $5,625 | $23,375 |
| 2021 | $5,166 | $29,003 | $5,628 | $23,375 |
| 2020 | $4,477 | $23,187 | $4,687 | $18,500 |
| 2019 | $4,548 | $26,053 | $4,687 | $21,366 |
| 2018 | $4,470 | $26,053 | $4,687 | $21,366 |
| 2017 | $4,069 | $22,265 | $4,125 | $18,140 |
| 2016 | $3,961 | $22,265 | $4,125 | $18,140 |
| 2015 | $3,601 | $22,265 | $4,125 | $18,140 |
| 2014 | $3,413 | $20,951 | $3,750 | $17,201 |
| 2013 | $3,335 | $20,951 | $3,750 | $17,201 |
Source: Public Records
Map
Nearby Homes
- 3036 N Long Ave
- 2939 N Lotus Ave
- 5243 W Oakdale Ave
- 5303 W George St
- 5244 W Barry Ave
- 3036 N Luna Ave
- 5254 W Wolfram St
- 3043 N Laramie Ave Unit 2
- 3045 N Laramie Ave Unit 2
- 5435 W Melrose St
- 4918-22 W Diversey Ave
- 5505 W Parker Ave
- 5233 W Parker Ave
- 5042 W Wellington Ave
- 5038 W Nelson St
- 5121 W Diversey Ave Unit 3N
- 5041 W Fletcher St
- 5330 W Drummond Place
- 5021 W Nelson St
- 2859 N Mango Ave
- 5342 W Wellington Ave
- 5348 W Wellington Ave
- 5340 W Wellington Ave
- 5350 W Wellington Ave
- 5354 W Wellington Ave
- 5354 W Wellington Ave
- 5336 W Wellington Ave
- 5334 W Wellington Ave
- 5358 W Wellington Ave Unit I
- 5358 W Wellington Ave
- 5358 W Wellington Ave Unit 2
- 5358 W Wellington Ave Unit 1
- 3009 N Long Ave Unit 2
- 5347 W Nelson St
- 5343 W Nelson St
- 5349 W Nelson St
- 5330 W Wellington Ave
- 5341 W Nelson St
- 5353 W Nelson St
- 5337 W Nelson St