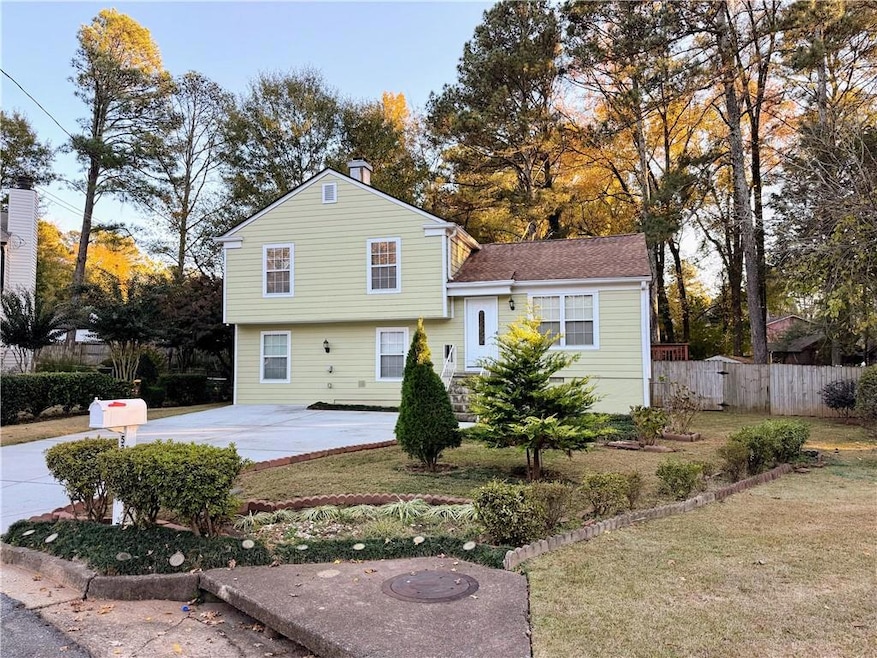
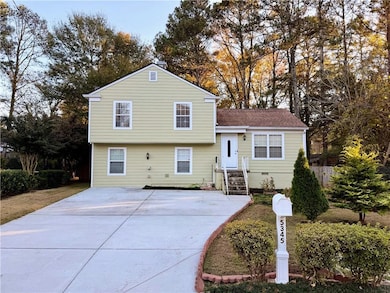
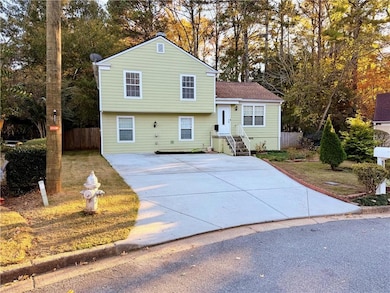
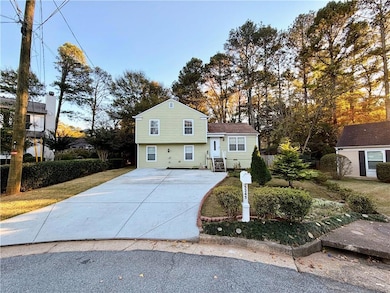
5345 Seattle Slew Ct Unit 3 Norcross, GA 30093
Estimated payment $2,141/month
Highlights
- Open-Concept Dining Room
- Property is near public transit
- Traditional Architecture
- McClure Health Science High School Rated A-
- Vaulted Ceiling
- Attic
About This Home
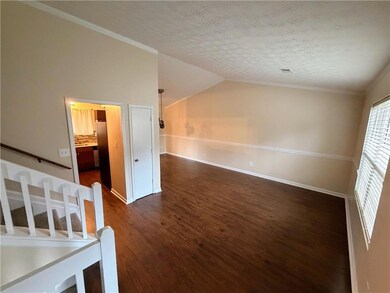
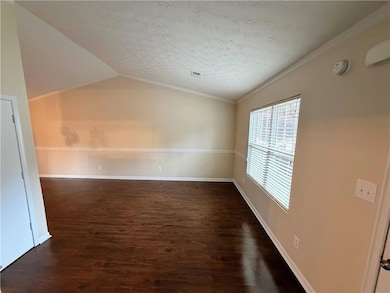
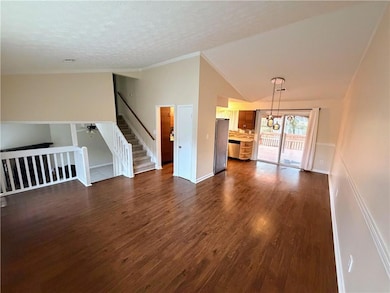
Welcome to 5345 Seattle Slew Court, a beautifully updated home tucked away in a quiet cul-de-sac in Norcross. This move-in-ready gem has been thoughtfully renovated inside and out, offering both comfort and peace of mind for years to come. Step inside to a bright, freshly painted interior featuring new carpet, LVP flooring in the main living areas, and a spacious family den complete with a cozy gas fireplace. The renovated kitchen shines with new quartz countertops (2024), a stylish backsplash, and stainless steel appliances—perfect for cooking and entertaining. All bathrooms have been completely renovated with modern tile, fixtures, and water-saving toilets. The primary suite includes a walk-in closet and an elegant walk-in shower, providing a true retreat. Major upgrades include fiber cement siding (2016), new interior and exterior A/C units (2016), a new roof (2017), and a new driveway (2017). A fully permitted 4th bedroom has been added, giving you even more flexible living space. Outside, enjoy a covered back deck ideal for BBQs, a spacious fenced backyard, and a storage shed for tools or hobbies. The front of the home is equipped with a NEMA 14-50 plug, perfect for EV charging or RV use. Located just minutes from the highway and steps from a newly built community park, this home blends convenience, comfort, and modern upgrades all in one. Truly a gem—come see everything this wonderful home has to offer!
Home Details
Home Type
- Single Family
Est. Annual Taxes
- $836
Year Built
- Built in 1980 | Remodeled
Lot Details
- 0.29 Acre Lot
- Lot Dimensions are 21 x111 x 113 x 49 x 137
- Cul-De-Sac
- Wood Fence
- Level Lot
- Back Yard Fenced and Front Yard
Home Design
- Traditional Architecture
- Split Level Home
- Combination Foundation
- Block Foundation
- Slab Foundation
- Shingle Roof
Interior Spaces
- 1,837 Sq Ft Home
- Rear Stairs
- Vaulted Ceiling
- Gas Log Fireplace
- Brick Fireplace
- Double Pane Windows
- Family Room with Fireplace
- Open-Concept Dining Room
- Den
- Neighborhood Views
- Attic
Kitchen
- Open to Family Room
- Gas Range
- Dishwasher
- Solid Surface Countertops
- Disposal
Flooring
- Carpet
- Luxury Vinyl Tile
Bedrooms and Bathrooms
- Split Bedroom Floorplan
- Walk-In Closet
- 2 Full Bathrooms
- Shower Only
Laundry
- Laundry Room
- Laundry on lower level
- 220 Volts In Laundry
- Electric Dryer Hookup
Home Security
- Carbon Monoxide Detectors
- Fire and Smoke Detector
Parking
- 4 Parking Spaces
- Driveway Level
Outdoor Features
- Covered Patio or Porch
- Exterior Lighting
- Shed
- Rain Gutters
Location
- Property is near public transit
- Property is near shops
Schools
- Lilburn Elementary And Middle School
- Meadowcreek High School
Utilities
- Forced Air Heating and Cooling System
- Heating System Uses Natural Gas
- 110 Volts
- Gas Water Heater
- Satellite Dish
- Cable TV Available
Listing and Financial Details
- Assessor Parcel Number R6172 198
Community Details
Overview
- Belmont Farms Subdivision
- Electric Vehicle Charging Station
Recreation
- Community Playground
- Park
Map
Home Values in the Area
Average Home Value in this Area
Tax History
| Year | Tax Paid | Tax Assessment Tax Assessment Total Assessment is a certain percentage of the fair market value that is determined by local assessors to be the total taxable value of land and additions on the property. | Land | Improvement |
|---|---|---|---|---|
| 2025 | $835 | $114,400 | $21,120 | $93,280 |
| 2024 | $836 | $108,720 | $21,120 | $87,600 |
| 2023 | $836 | $100,360 | $20,000 | $80,360 |
| 2022 | $0 | $88,600 | $14,000 | $74,600 |
| 2021 | $781 | $65,040 | $14,000 | $51,040 |
| 2020 | $781 | $65,040 | $14,000 | $51,040 |
| 2019 | $1,740 | $50,560 | $11,600 | $38,960 |
| 2018 | $1,786 | $50,560 | $11,600 | $38,960 |
| 2016 | $1,360 | $37,800 | $9,200 | $28,600 |
| 2015 | $1,081 | $28,080 | $6,000 | $22,080 |
| 2014 | -- | $28,080 | $6,000 | $22,080 |
Property History
| Date | Event | Price | List to Sale | Price per Sq Ft |
|---|---|---|---|---|
| 12/05/2025 12/05/25 | For Sale | $395,000 | -- | $215 / Sq Ft |
Purchase History
| Date | Type | Sale Price | Title Company |
|---|---|---|---|
| Quit Claim Deed | -- | -- | |
| Warranty Deed | -- | -- | |
| Deed | $71,000 | -- |
Mortgage History
| Date | Status | Loan Amount | Loan Type |
|---|---|---|---|
| Open | $30,000 | New Conventional | |
| Previous Owner | $67,450 | No Value Available |
Source: First Multiple Listing Service (FMLS)
MLS Number: 7687811
APN: 6-172-198
Disclaimer: Certain information contained herein is derived from information provided by parties other than Homes.com. All information provided is deemed reliable, but is not guaranteed to be accurate and should be independently verified.
![]() Listings identified with the FMLS IDX logo come from FMLS and are held by brokerage firms other than the owner of this website. The listing brokerage is identified in any listing details. Information is deemed reliable but is not guaranteed. If you believe any FMLS listing contains material that infringes your copyrighted work please visit www.fmls.com/dmca to review our DMCA policy and learn how to submit a takedown request. © 2025 First Multiple Listing Service, Inc.
Listings identified with the FMLS IDX logo come from FMLS and are held by brokerage firms other than the owner of this website. The listing brokerage is identified in any listing details. Information is deemed reliable but is not guaranteed. If you believe any FMLS listing contains material that infringes your copyrighted work please visit www.fmls.com/dmca to review our DMCA policy and learn how to submit a takedown request. © 2025 First Multiple Listing Service, Inc.
- 5333 Bishops Cir
- 5271 Williams Rd Unit A-1
- 1133 Sandune Dr
- 5323 Sherwin Dr
- 5331 Sherwin Dr
- 5343 Sherwin Dr Unit 15
- 5181 Cold Springs Dr NW
- 5431 Village Green Square Unit 1018
- 5425 Village Green Square Unit 3
- 1066 Worcester Place NW Unit 4
- 1013 Sandune Dr
- 5554 Clover Rise Ln Unit 2
- 5148 Whited Way NW Unit 1
- 0 Harbins Rd NW Unit 7598091
- 1413 Silver Lake Dr
- 5605 Rock Place Ct
- 897 Six Oaks Cir Unit B
- 936 Six Oaks Cir Unit B
- 1437 Roman Point Dr
- 1088 Riva Ridge Dr NW
- 6126 Rockbridge School Rd
- 1074 Sparrow Ct
- 1301 Kings Ridge Dr NW Unit ID1254389P
- 1342 Country Downs Dr Unit ID1341827P
- 1012 Harbins Rd
- 966 Amberly Dr Unit B
- 5176 Paisley Ct NW
- 948 Waverly Ct
- 4966 Cold Springs Dr NW
- 1422 Kings Ridge Dr
- 893 Sandune Dr
- 926 Amberly Dr
- 1379 Robin Hill Dr
- 1416 Fern Ridge Ln
- 1335 Indian Trail Liburn Rd NW
- 1121 Indian Trial Rd
- 5260 Harbins Point Ln NW
- 5359 Stafford Dr NW Unit 3
- 1800 Hampton Crossing
