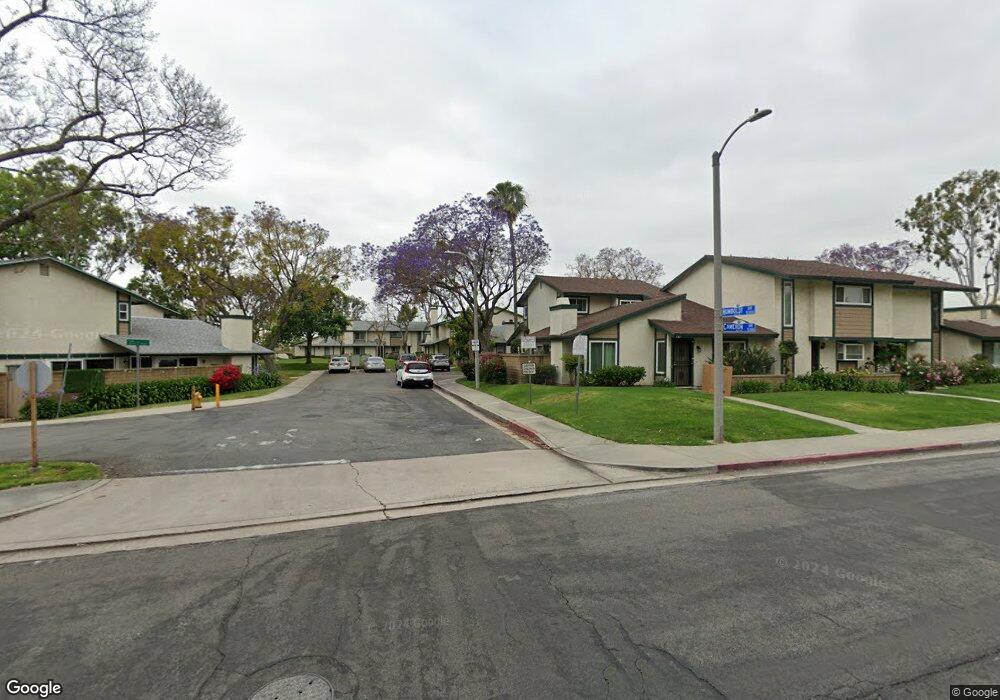
5347 Humboldt Dr Buena Park, CA 90621
Estimated Value: $761,984 - $811,000
3
Beds
3
Baths
1,533
Sq Ft
$514/Sq Ft
Est. Value
About This Home
This home is located at 5347 Humboldt Dr, Buena Park, CA 90621 and is currently estimated at $788,496, approximately $514 per square foot. 5347 Humboldt Dr is a home located in Orange County with nearby schools including Gordon H. Beatty Elementary School, Buena Park Junior High School, and Sunny Hills High School.
Ownership History
Date
Name
Owned For
Owner Type
Purchase Details
Closed on
Mar 28, 1997
Sold by
Ko Myong Sin
Bought by
Chun Myong Su
Current Estimated Value
Home Financials for this Owner
Home Financials are based on the most recent Mortgage that was taken out on this home.
Original Mortgage
$117,600
Outstanding Balance
$11,327
Interest Rate
4.85%
Mortgage Type
Purchase Money Mortgage
Estimated Equity
$777,169
Purchase Details
Closed on
Mar 25, 1997
Sold by
Chun Steven
Bought by
Chun Myong Su
Home Financials for this Owner
Home Financials are based on the most recent Mortgage that was taken out on this home.
Original Mortgage
$117,600
Outstanding Balance
$11,327
Interest Rate
4.85%
Mortgage Type
Purchase Money Mortgage
Estimated Equity
$777,169
Purchase Details
Closed on
Oct 30, 1995
Sold by
Chun Myong Su and Ko Pyong Soon
Bought by
Chun Myong Su and Ko Myong Sin
Create a Home Valuation Report for This Property
The Home Valuation Report is an in-depth analysis detailing your home's value as well as a comparison with similar homes in the area
Home Values in the Area
Average Home Value in this Area
Purchase History
| Date | Buyer | Sale Price | Title Company |
|---|---|---|---|
| Chun Myong Su | -- | Stewart Title Company | |
| Chun Myong Su | -- | Stewart Title | |
| Chun Myong Su | -- | -- |
Source: Public Records
Mortgage History
| Date | Status | Borrower | Loan Amount |
|---|---|---|---|
| Open | Chun Myong Su | $117,600 |
Source: Public Records
Tax History Compared to Growth
Tax History
| Year | Tax Paid | Tax Assessment Tax Assessment Total Assessment is a certain percentage of the fair market value that is determined by local assessors to be the total taxable value of land and additions on the property. | Land | Improvement |
|---|---|---|---|---|
| 2025 | $3,016 | $254,809 | $104,419 | $150,390 |
| 2024 | $3,016 | $249,813 | $102,371 | $147,442 |
| 2023 | $2,951 | $244,915 | $100,364 | $144,551 |
| 2022 | $2,899 | $240,113 | $98,396 | $141,717 |
| 2021 | $2,876 | $235,405 | $96,466 | $138,939 |
| 2020 | $2,840 | $232,992 | $95,477 | $137,515 |
| 2019 | $2,775 | $228,424 | $93,605 | $134,819 |
| 2018 | $2,722 | $223,946 | $91,770 | $132,176 |
| 2017 | $2,682 | $219,555 | $89,970 | $129,585 |
| 2016 | $2,629 | $215,250 | $88,205 | $127,045 |
| 2015 | $2,518 | $212,017 | $86,880 | $125,137 |
| 2014 | $2,506 | $207,864 | $85,178 | $122,686 |
Source: Public Records
Map
Nearby Homes
- 8244 Henderson Green
- 5412 Arrowhead Ave
- 5211 Fox Hills Ave
- 8237 Henshaw Cir
- 4738 Durango Dr
- 5588 Cajon Ave
- 4900 Lincolnshire Ave
- 8542 Emerywood Dr
- 9 Coveside Ct
- 5822 Fullerton Ave
- 5941 Stanton Ave
- 65 Windward Way Unit 23
- 15213 Santa Gertrudes Ave Unit W106
- 15233 Santa Gertrudes Ave
- 5786 Kingman Ave
- 11 Travis Rd
- 15220 Ocaso Ave Unit H103
- 15224 Ocaso Ave Unit H212
- 14828 Rayfield Dr
- 5741 Burnham Ave
- 5349 Humboldt Dr
- 5345 Humboldt Dr
- 5351 Humboldt Dr
- 5335 Humboldt Dr
- 5333 Humboldt Dr
- 5353 Humboldt Dr
- 5331 Humboldt Dr
- 5355 Humboldt Dr
- 5343 Humboldt Dr
- 5329 Humboldt Dr
- 5341 Humboldt Dr
- 5357 Humboldt Dr
- 5339 Humboldt Dr
- 5327 Humboldt Dr
- 5365 Humboldt Dr
- 5363 Humboldt Dr
- 5359 Humboldt Dr
- 5367 Humboldt Dr
- 5337 Humboldt Dr
- 5361 Humboldt Dr