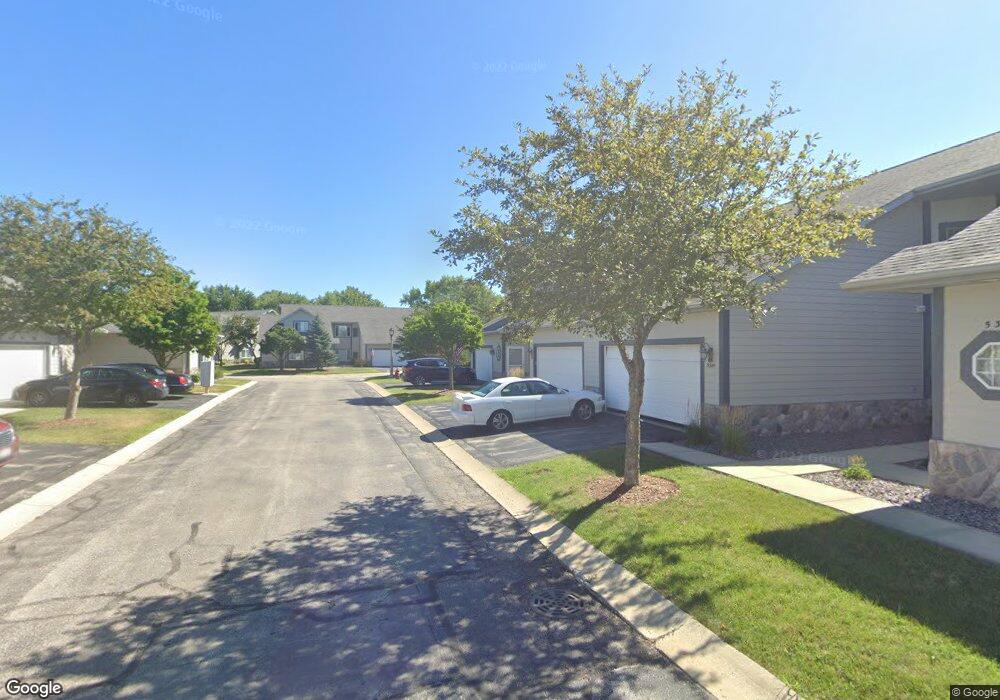
5347 S Hidden Dr Unit D Milwaukee, WI 53221
Estimated Value: $293,544 - $308,000
2
Beds
2
Baths
1,546
Sq Ft
$194/Sq Ft
Est. Value
About This Home
This home is located at 5347 S Hidden Dr Unit D, Milwaukee, WI 53221 and is currently estimated at $300,136, approximately $194 per square foot. 5347 S Hidden Dr Unit D is a home located in Milwaukee County with nearby schools including Elm Dale Elementary School, Greenfield Middle School, and Greenfield High School.
Ownership History
Date
Name
Owned For
Owner Type
Purchase Details
Closed on
Dec 15, 2016
Sold by
Foley Rhoda
Bought by
Brown Temu K
Current Estimated Value
Home Financials for this Owner
Home Financials are based on the most recent Mortgage that was taken out on this home.
Original Mortgage
$114,000
Outstanding Balance
$92,110
Interest Rate
3.54%
Mortgage Type
New Conventional
Estimated Equity
$208,026
Purchase Details
Closed on
Aug 5, 2013
Sold by
Foley Rhoda and Foley Rhoda
Bought by
Foley Rhoda
Purchase Details
Closed on
Oct 20, 2009
Sold by
Narlock Cecile
Bought by
The Cecile Narlock Revocable Trust
Purchase Details
Closed on
Oct 1, 2001
Sold by
Weber Homes Inc
Bought by
Narlock Cecile S
Home Financials for this Owner
Home Financials are based on the most recent Mortgage that was taken out on this home.
Original Mortgage
$87,900
Interest Rate
7.26%
Mortgage Type
Purchase Money Mortgage
Create a Home Valuation Report for This Property
The Home Valuation Report is an in-depth analysis detailing your home's value as well as a comparison with similar homes in the area
Home Values in the Area
Average Home Value in this Area
Purchase History
| Date | Buyer | Sale Price | Title Company |
|---|---|---|---|
| Brown Temu K | $143,400 | None Available | |
| Foley Rhoda | -- | None Available | |
| The Cecile Narlock Revocable Trust | -- | None Available | |
| Narlock Cecile S | $145,900 | -- |
Source: Public Records
Mortgage History
| Date | Status | Borrower | Loan Amount |
|---|---|---|---|
| Open | Brown Temu K | $114,000 | |
| Previous Owner | Narlock Cecile S | $87,900 |
Source: Public Records
Tax History Compared to Growth
Tax History
| Year | Tax Paid | Tax Assessment Tax Assessment Total Assessment is a certain percentage of the fair market value that is determined by local assessors to be the total taxable value of land and additions on the property. | Land | Improvement |
|---|---|---|---|---|
| 2024 | $4,185 | $241,800 | $35,000 | $206,800 |
| 2023 | $4,185 | $241,800 | $35,000 | $206,800 |
| 2022 | $3,386 | $131,800 | $27,000 | $104,800 |
| 2021 | $3,294 | $131,800 | $27,000 | $104,800 |
| 2020 | $3,415 | $131,800 | $27,000 | $104,800 |
| 2019 | $3,312 | $131,800 | $27,000 | $104,800 |
| 2018 | $3,743 | $131,800 | $27,000 | $104,800 |
| 2017 | $3,405 | $131,800 | $27,000 | $104,800 |
| 2016 | $3,466 | $131,800 | $27,000 | $104,800 |
| 2015 | $3,416 | $131,800 | $27,000 | $104,800 |
| 2014 | $3,285 | $131,800 | $27,000 | $104,800 |
| 2013 | $3,368 | $131,800 | $27,000 | $104,800 |
Source: Public Records
Map
Nearby Homes
- 5384 S Hidden Dr Unit A
- 5228 S Hidden Dr Unit 5228
- 5266 Somerset Ln S Unit 106
- 5339 S Cambridge Ln
- 5271 S Acorn Ln Unit 10
- 5110 S Hidden Dr Unit 5110
- 5200 S Tuckaway Blvd Unit 108
- 5444 Morningside Ln Unit 53
- 3202 W King Arthurs Ct
- 3306 W Edgerton Ave
- 3020 W Edgerton Ave
- 4100 W Edgerton Ave
- 4225 W Grange Ave Unit 4225
- 4343 W Mallory Ave
- 2510 W Abbott Ave
- 4300 W Grange Ave Unit 8
- 4300 W Grange Ave Unit 5
- 5554 S 25th St
- 4893 S Waterview Ct Unit 17
- 2741 W Layton Ave
- 5381 S Hidden Dr Unit 12C
- 5387 S Hidden Dr Unit 12B
- 5385 S Hidden Dr Unit 12A
- 5380 S Hidden Dr Unit 11C
- 5388 S Hidden Dr
- 5384 S Hidden Dr Unit 11A
- 5345 S Hidden Dr Unit B
- 5340 S Hidden Dr Unit D
- 5344 S Hidden Dr Unit C
- 5342 S Hidden Dr Unit 10A
- 5346 S Hidden Dr Unit A
- 5314 S Hidden Dr Unit 9D
- 5310 S Hidden Dr Unit C
- 5312 S Hidden Dr Unit B
- 5306 S Hidden Dr Unit D9A
- 5302 S Hidden Dr Unit C
- 5304 S Hidden Dr Unit 9AB
- 5300 S Hidden Dr Unit A
- 5326 S Hidden Dr
- 5322 S Hidden Dr