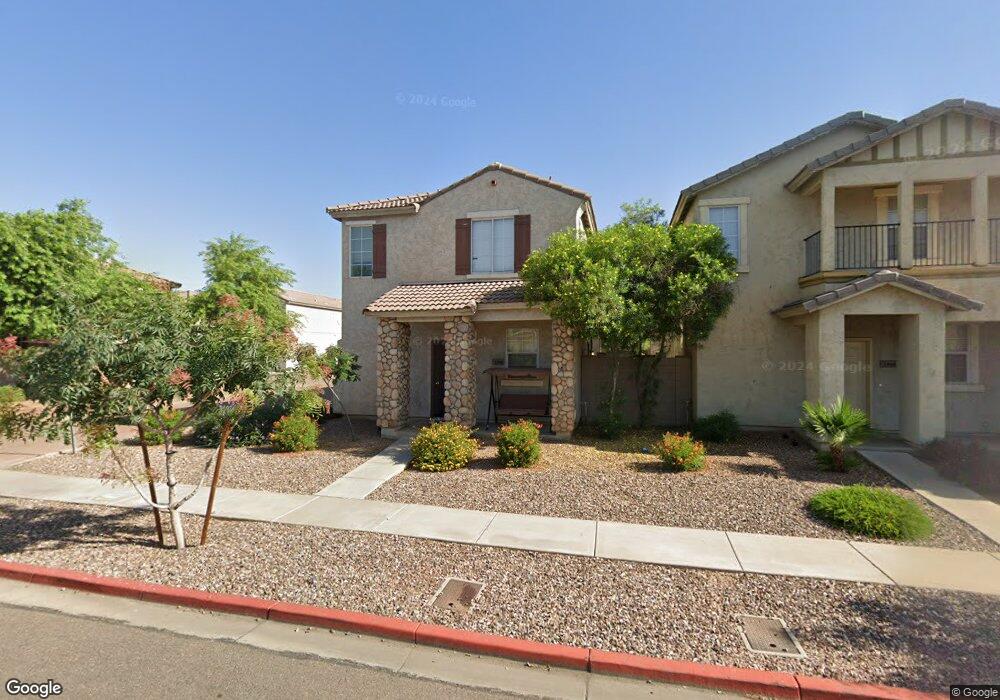
5348 W Illini St Unit A Phoenix, AZ 85043
Estrella Village NeighborhoodEstimated Value: $311,484 - $330,000
3
Beds
3
Baths
1,398
Sq Ft
$229/Sq Ft
Est. Value
About This Home
This home is located at 5348 W Illini St Unit A, Phoenix, AZ 85043 and is currently estimated at $319,621, approximately $228 per square foot. 5348 W Illini St Unit A is a home located in Maricopa County with nearby schools including Kings Ridge Preparatory Academy, Betty Fairfax High School, and Phoenix Coding Academy.
Ownership History
Date
Name
Owned For
Owner Type
Purchase Details
Closed on
Jun 24, 2011
Sold by
Rio Lado Holdings Llc
Bought by
Tsc Commercialproperty Holdings Llc
Current Estimated Value
Purchase Details
Closed on
May 15, 2011
Sold by
Secretary Of Housing & Urban Development
Bought by
Rio Lado Holdings Llc
Purchase Details
Closed on
Jul 22, 2010
Sold by
Chase Home Finance Llc
Bought by
The Secretary Of Housing & Urban Develop
Purchase Details
Closed on
Jul 15, 2010
Sold by
Zajic Dragan and Zajic Maria Teresa
Bought by
Chase Home Finance Llc
Purchase Details
Closed on
Jul 11, 2005
Sold by
K Hovnanian Great Western Homes Llc
Bought by
Zajic Dragan and Zajic Maria Teresa
Home Financials for this Owner
Home Financials are based on the most recent Mortgage that was taken out on this home.
Original Mortgage
$167,050
Interest Rate
5.56%
Mortgage Type
New Conventional
Create a Home Valuation Report for This Property
The Home Valuation Report is an in-depth analysis detailing your home's value as well as a comparison with similar homes in the area
Home Values in the Area
Average Home Value in this Area
Purchase History
| Date | Buyer | Sale Price | Title Company |
|---|---|---|---|
| Tsc Commercialproperty Holdings Llc | $68,000 | First American Title Ins Co | |
| Rio Lado Holdings Llc | -- | Grand Canyon Title Agency | |
| The Secretary Of Housing & Urban Develop | -- | None Available | |
| Chase Home Finance Llc | $168,027 | None Available | |
| Zajic Dragan | $169,691 | Lawyers Title Ins | |
| K Hovnanian Great Western Homes Llc | $78,604 | Lawyers Title Ins |
Source: Public Records
Mortgage History
| Date | Status | Borrower | Loan Amount |
|---|---|---|---|
| Previous Owner | Zajic Dragan | $167,050 |
Source: Public Records
Tax History
| Year | Tax Paid | Tax Assessment Tax Assessment Total Assessment is a certain percentage of the fair market value that is determined by local assessors to be the total taxable value of land and additions on the property. | Land | Improvement |
|---|---|---|---|---|
| 2025 | $1,153 | $9,444 | -- | -- |
| 2024 | $1,090 | $8,995 | -- | -- |
| 2023 | $1,090 | $23,400 | $4,680 | $18,720 |
| 2022 | $1,075 | $17,150 | $3,430 | $13,720 |
| 2021 | $1,073 | $15,720 | $3,140 | $12,580 |
| 2020 | $1,054 | $13,930 | $2,780 | $11,150 |
| 2019 | $1,034 | $12,720 | $2,540 | $10,180 |
| 2018 | $1,020 | $11,710 | $2,340 | $9,370 |
| 2017 | $958 | $9,900 | $1,980 | $7,920 |
| 2016 | $914 | $8,880 | $1,770 | $7,110 |
| 2015 | $836 | $8,000 | $1,600 | $6,400 |
Source: Public Records
Map
Nearby Homes
- 5437 W Albeniz Place
- 3709 S 52nd Ln Unit A
- 5319 W Burton Dr
- 5432 W Burton Dr
- 5464 W Fulton St
- 5470 W Fulton St
- 5480 W Fulton St
- 5141 W Warner St
- 5545 W Jones Ave
- 5722 W Atlantis Ave
- 5733 W Odeum Ln
- 5740 W Raymond St
- 5722 W Getty Dr
- 5813 W Warner St
- 4110 S 58th Ln
- 4114 S 58th Ln
- 4130 S 58th Ln
- 4236 S 58th Ln
- 11821 S 51st Ave
- 4015 S 59th Ln Unit IV
- 5344 W Illini St
- 5340 W Illini St Unit A
- 5406 W Illini St
- 5336 W Illini St
- 5349 W Warner St
- 5345 W Warner St
- 5347 W Illini St
- 5410 W Illini St
- 5343 W Illini St
- 5341 W Warner St
- 5339 W Illini St
- 5405 W Warner St
- 5332 W Illini St Unit A
- 5403 W Illini St
- 5337 W Warner St
- 5414 W Illini St
- 5335 W Illini St
- 5409 W Warner St
- 5407 W Illini St
- 5328 W Illini St
Your Personal Tour Guide
Ask me questions while you tour the home.