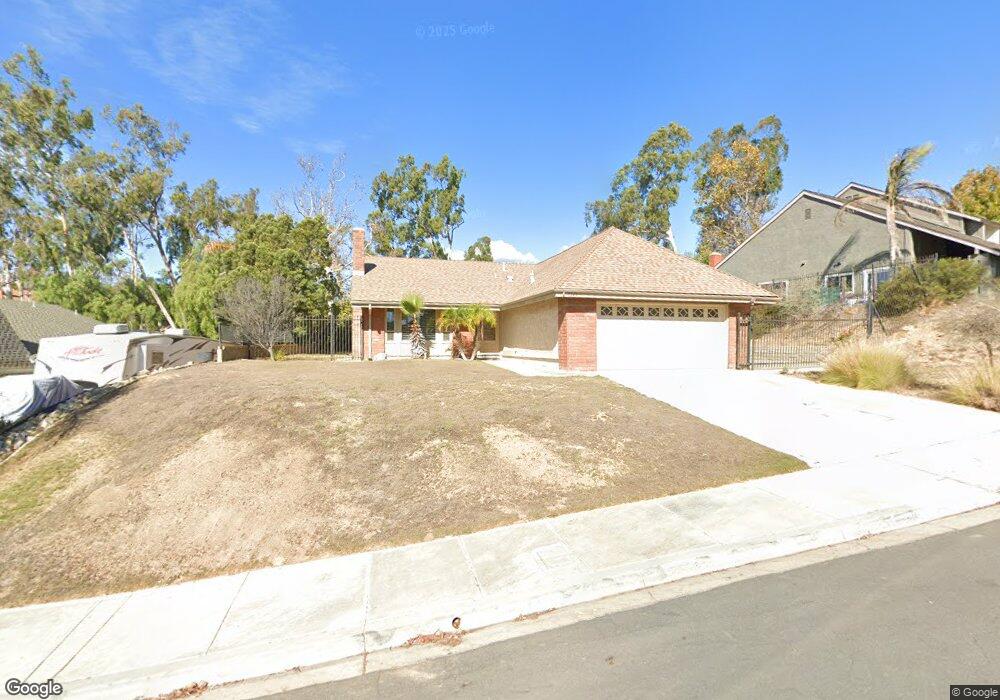
5349 Maple View Cir Camarillo, CA 93012
Estimated Value: $903,000 - $946,551
3
Beds
2
Baths
1,582
Sq Ft
$585/Sq Ft
Est. Value
About This Home
This home is located at 5349 Maple View Cir, Camarillo, CA 93012 and is currently estimated at $925,388, approximately $584 per square foot. 5349 Maple View Cir is a home located in Ventura County with nearby schools including Tierra Linda Elementary School, Las Colinas Middle School, and Adolfo Camarillo High School.
Ownership History
Date
Name
Owned For
Owner Type
Purchase Details
Closed on
Mar 2, 2006
Sold by
Dawson Terri L
Bought by
Radke Daniel
Current Estimated Value
Home Financials for this Owner
Home Financials are based on the most recent Mortgage that was taken out on this home.
Original Mortgage
$510,000
Outstanding Balance
$289,591
Interest Rate
6.25%
Mortgage Type
Fannie Mae Freddie Mac
Estimated Equity
$635,797
Purchase Details
Closed on
Feb 23, 2005
Sold by
Dawson Jeffrey L
Bought by
Dawson Terri L
Home Financials for this Owner
Home Financials are based on the most recent Mortgage that was taken out on this home.
Original Mortgage
$425,000
Interest Rate
4.5%
Mortgage Type
New Conventional
Purchase Details
Closed on
Jan 25, 2001
Sold by
Fung Y P and Fung F
Bought by
Dawson Jeffrey L and Dawson Terri L
Home Financials for this Owner
Home Financials are based on the most recent Mortgage that was taken out on this home.
Original Mortgage
$234,400
Interest Rate
7.06%
Create a Home Valuation Report for This Property
The Home Valuation Report is an in-depth analysis detailing your home's value as well as a comparison with similar homes in the area
Home Values in the Area
Average Home Value in this Area
Purchase History
| Date | Buyer | Sale Price | Title Company |
|---|---|---|---|
| Radke Daniel | $675,000 | Fidelity Van Nuys | |
| Dawson Terri L | -- | Fidelity National Title Co | |
| Dawson Jeffrey L | $293,000 | American Title Co |
Source: Public Records
Mortgage History
| Date | Status | Borrower | Loan Amount |
|---|---|---|---|
| Open | Radke Daniel | $510,000 | |
| Previous Owner | Dawson Terri L | $425,000 | |
| Previous Owner | Dawson Jeffrey L | $234,400 |
Source: Public Records
Tax History
| Year | Tax Paid | Tax Assessment Tax Assessment Total Assessment is a certain percentage of the fair market value that is determined by local assessors to be the total taxable value of land and additions on the property. | Land | Improvement |
|---|---|---|---|---|
| 2025 | $9,800 | $922,426 | $599,580 | $322,846 |
| 2024 | $9,800 | $884,000 | $574,000 | $310,000 |
| 2023 | $9,244 | $848,000 | $551,000 | $297,000 |
| 2022 | $7,985 | $720,000 | $468,000 | $252,000 |
| 2021 | $7,546 | $692,000 | $450,000 | $242,000 |
| 2020 | $6,742 | $614,000 | $399,000 | $215,000 |
| 2019 | $7,033 | $631,000 | $410,000 | $221,000 |
| 2018 | $6,607 | $592,000 | $385,000 | $207,000 |
| 2017 | $6,148 | $574,000 | $373,000 | $201,000 |
| 2016 | $6,024 | $565,000 | $367,000 | $198,000 |
| 2015 | $5,858 | $547,000 | $355,000 | $192,000 |
| 2014 | $5,537 | $519,000 | $337,000 | $182,000 |
Source: Public Records
Map
Nearby Homes
- 7177 Village 7
- 5154 Village 5
- 5142 Village 5
- 11251 Village 11
- 5211 Village 5
- 472 Madreselva Ct
- 7115 Village 7 Unit 7
- 7202 Village 7 Unit 7
- 3225 Village 3
- 1425 Calle Lozano
- 13221 Village 13
- 13215 Village 13
- 6204 Village 6
- 4208 Village 4
- 1356 El Lazo Ct
- 15421 Village 15 Unit 15
- 1288 Old Ranch Rd
- 17132 Village 17 Unit 17
- 17306 Village 17 Unit 17
- 17164 Village 17
- 5363 Maple View Cir
- 5335 Maple View Cir
- 5377 Maple View Cir
- 918 Hickory View Cir
- 5321 Maple View Cir
- 5348 Maple View Cir
- 5334 Maple View Cir
- 5362 Maple View Cir
- 5320 Maple View Cir
- 5376 Maple View Cir
- 930 Hickory View Cir
- 5391 Maple View Cir
- 5307 Maple View Cir
- 5380 Willow View Dr
- 907 Hickory View Cir
- 5404 Willow View Dr
- 942 Hickory View Cir
- 5306 Maple View Cir
- 5372 Willow View Dr
- 919 Hickory View Cir
Your Personal Tour Guide
Ask me questions while you tour the home.