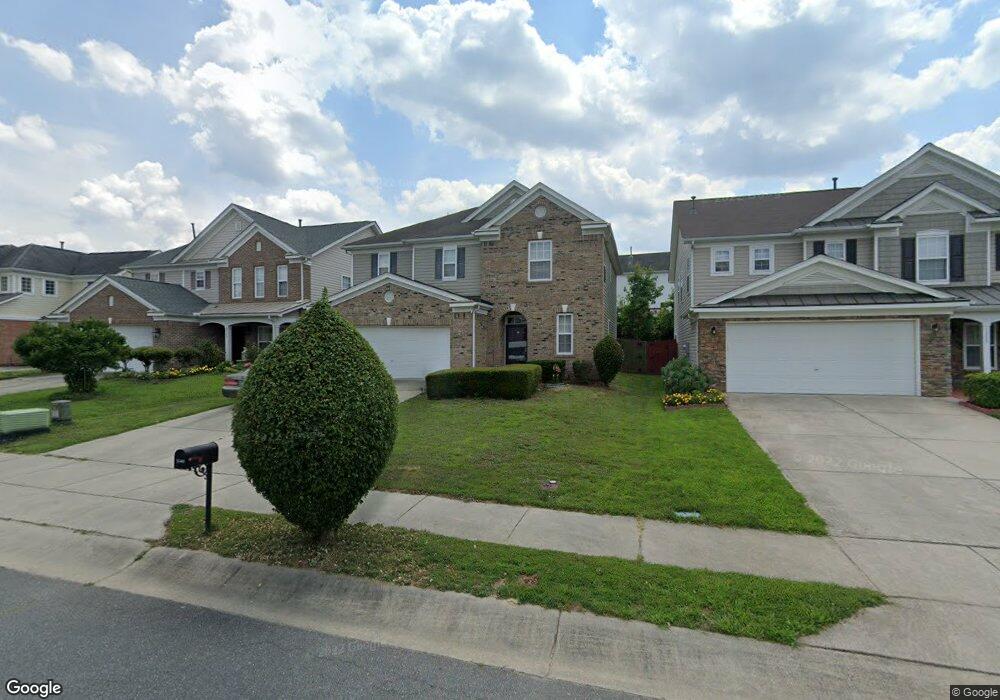
5349 Meryton Pkwy Raleigh, NC 27616
Forestville NeighborhoodEstimated Value: $385,826 - $437,000
--
Bed
3
Baths
2,214
Sq Ft
$183/Sq Ft
Est. Value
About This Home
This home is located at 5349 Meryton Pkwy, Raleigh, NC 27616 and is currently estimated at $405,957, approximately $183 per square foot. 5349 Meryton Pkwy is a home located in Wake County with nearby schools including Wildwood Forest Elementary, East Millbrook Middle, and Wakefield High School.
Ownership History
Date
Name
Owned For
Owner Type
Purchase Details
Closed on
Jun 9, 2022
Sold by
Thi Bo Kim Thanh
Bought by
Fkh Sfr Propco K Lp
Current Estimated Value
Purchase Details
Closed on
Mar 13, 2018
Sold by
King Leonard Lew A and Lewaking Leonard
Bought by
Bo Kim Thanh Thi
Home Financials for this Owner
Home Financials are based on the most recent Mortgage that was taken out on this home.
Original Mortgage
$185,600
Interest Rate
4.22%
Mortgage Type
New Conventional
Purchase Details
Closed on
Mar 24, 2005
Sold by
Kb Home Raleigh Durham Llc
Bought by
King Leonard Lew A
Home Financials for this Owner
Home Financials are based on the most recent Mortgage that was taken out on this home.
Original Mortgage
$148,200
Interest Rate
5.54%
Mortgage Type
Fannie Mae Freddie Mac
Purchase Details
Closed on
Dec 1, 2004
Sold by
Thornton Ventures Llc
Bought by
Kb Home Raleigh Durham Llc
Create a Home Valuation Report for This Property
The Home Valuation Report is an in-depth analysis detailing your home's value as well as a comparison with similar homes in the area
Home Values in the Area
Average Home Value in this Area
Purchase History
| Date | Buyer | Sale Price | Title Company |
|---|---|---|---|
| Fkh Sfr Propco K Lp | $442,000 | Midtown Property Law | |
| Bo Kim Thanh Thi | $232,000 | None Available | |
| King Leonard Lew A | $185,500 | -- | |
| Kb Home Raleigh Durham Llc | $1,023,000 | -- |
Source: Public Records
Mortgage History
| Date | Status | Borrower | Loan Amount |
|---|---|---|---|
| Previous Owner | Bo Kim Thanh Thi | $185,600 | |
| Previous Owner | King Leonard Lew A | $148,200 | |
| Closed | King Leonard Lew A | $37,051 |
Source: Public Records
Tax History Compared to Growth
Tax History
| Year | Tax Paid | Tax Assessment Tax Assessment Total Assessment is a certain percentage of the fair market value that is determined by local assessors to be the total taxable value of land and additions on the property. | Land | Improvement |
|---|---|---|---|---|
| 2025 | $3,515 | $400,712 | $80,000 | $320,712 |
| 2024 | $3,500 | $400,712 | $80,000 | $320,712 |
| 2023 | $2,553 | $232,366 | $42,000 | $190,366 |
| 2022 | $2,373 | $232,366 | $42,000 | $190,366 |
| 2021 | $2,281 | $232,366 | $42,000 | $190,366 |
| 2020 | $2,240 | $232,366 | $42,000 | $190,366 |
| 2019 | $2,240 | $191,572 | $30,000 | $161,572 |
| 2018 | $2,113 | $191,572 | $30,000 | $161,572 |
| 2017 | $2,013 | $191,572 | $30,000 | $161,572 |
| 2016 | $1,972 | $191,572 | $30,000 | $161,572 |
| 2015 | $2,156 | $206,310 | $36,000 | $170,310 |
| 2014 | -- | $206,310 | $36,000 | $170,310 |
Source: Public Records
Map
Nearby Homes
- 8911 Elizabeth Benneth Place
- 5126 Thornton Knoll Way
- 8857 Thornton Town Place
- 8947 Commons Townes Dr
- 8957 Commons Townes Dr
- 5163 Sandy Banks Rd
- 5107 Sandy Banks Rd
- 8885 Commons Townes Dr
- 5121 Neuse Commons Ln
- 8707 River Keeper Way
- 8640 Neuse Landing Ln Unit 110
- SYDNEY Plan at Thornton Townes
- JONATHAN Plan at Thornton Townes
- 8610 Neuse Landing Ln Unit 103
- 8620 Neuse Club Ln Unit 111
- 8620 Neuse Club Ln Unit 107
- 5309 Neuse Wood Dr
- 8702 Neuse Town Dr
- 8529 Beckett Chase Way
- 8537 Beckett Chase Way
- 5349 Meryton Park Way
- 5353 Meryton Park Way
- 5345 Meryton Park Way
- 5353 Meryton Pkwy
- 5345 Meryton Pkwy
- 5357 Meryton Pkwy
- 5341 Meryton Pkwy
- 5341 Meryton Park Way
- 5357 Meryton Park Way
- 8882 Elizabeth Bennett Place
- 8882 Elizabeth Bennet Place
- 8878 Elizabeth Bennet Place
- 8882 Elizabeth Bennet Piace
- 5356 Meryton Park Way
- 8886 Elizabeth Bennet Place
- 8874 Elizabeth Bennett Place
- 8874 Elizabeth Bennet Place
- 5361 Meryton Pkwy
- 5337 Meryton Pkwy
- 8890 Elizabeth Bennett Place