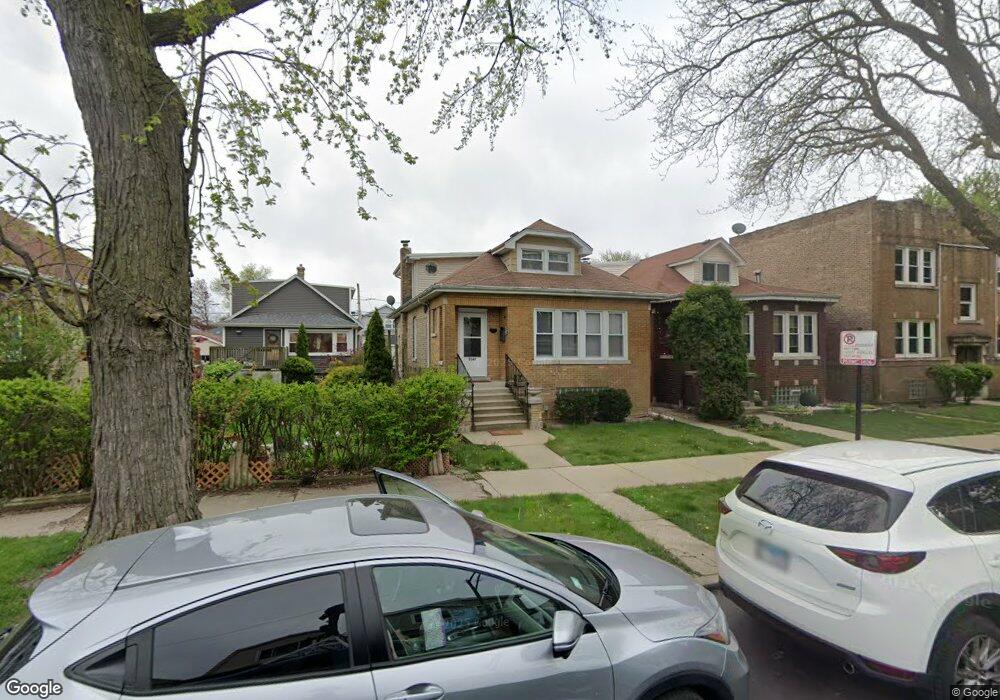
5349 W Fletcher St Chicago, IL 60641
Cragin NeighborhoodEstimated Value: $410,367 - $500,000
3
Beds
2
Baths
1,687
Sq Ft
$266/Sq Ft
Est. Value
About This Home
This home is located at 5349 W Fletcher St, Chicago, IL 60641 and is currently estimated at $448,842, approximately $266 per square foot. 5349 W Fletcher St is a home located in Cook County with nearby schools including Camras Elementary School, Foreman College and Career Academy, and St Ferdinand Parish School.
Ownership History
Date
Name
Owned For
Owner Type
Purchase Details
Closed on
Jul 5, 2006
Sold by
Diaz Ernest
Bought by
Romero Antonia
Current Estimated Value
Home Financials for this Owner
Home Financials are based on the most recent Mortgage that was taken out on this home.
Original Mortgage
$306,400
Outstanding Balance
$194,504
Interest Rate
7.94%
Mortgage Type
Unknown
Estimated Equity
$254,338
Purchase Details
Closed on
Jun 28, 2004
Sold by
Torres Luis A and Torres Maria D
Bought by
Diaz Ernest
Home Financials for this Owner
Home Financials are based on the most recent Mortgage that was taken out on this home.
Original Mortgage
$192,000
Interest Rate
6.37%
Mortgage Type
Stand Alone First
Purchase Details
Closed on
Aug 27, 1997
Sold by
Humenny William and Humenny Maria
Bought by
Torres Luis A and Torres Maria D
Home Financials for this Owner
Home Financials are based on the most recent Mortgage that was taken out on this home.
Original Mortgage
$117,894
Interest Rate
7.44%
Mortgage Type
FHA
Create a Home Valuation Report for This Property
The Home Valuation Report is an in-depth analysis detailing your home's value as well as a comparison with similar homes in the area
Home Values in the Area
Average Home Value in this Area
Purchase History
| Date | Buyer | Sale Price | Title Company |
|---|---|---|---|
| Romero Antonia | $383,000 | Multiple | |
| Romero Antonia | $383,000 | Multiple | |
| Diaz Ernest | $240,000 | -- | |
| Torres Luis A | $78,666 | Prairie Title |
Source: Public Records
Mortgage History
| Date | Status | Borrower | Loan Amount |
|---|---|---|---|
| Open | Romero Antonia | $306,400 | |
| Closed | Romero Antonia | $306,400 | |
| Previous Owner | Diaz Ernest | $192,000 | |
| Previous Owner | Torres Luis A | $117,894 |
Source: Public Records
Tax History Compared to Growth
Tax History
| Year | Tax Paid | Tax Assessment Tax Assessment Total Assessment is a certain percentage of the fair market value that is determined by local assessors to be the total taxable value of land and additions on the property. | Land | Improvement |
|---|---|---|---|---|
| 2024 | $3,425 | $39,001 | $6,938 | $32,063 |
| 2023 | $3,444 | $34,000 | $5,625 | $28,375 |
| 2022 | $3,444 | $34,000 | $5,625 | $28,375 |
| 2021 | $3,279 | $34,003 | $5,628 | $28,375 |
| 2020 | $3,384 | $23,763 | $4,687 | $19,076 |
| 2019 | $3,373 | $26,700 | $4,687 | $22,013 |
| 2018 | $3,323 | $26,700 | $4,687 | $22,013 |
| 2017 | $3,557 | $28,718 | $4,125 | $24,593 |
| 2016 | $3,927 | $28,718 | $4,125 | $24,593 |
| 2015 | $3,774 | $28,718 | $4,125 | $24,593 |
| 2014 | $3,743 | $25,143 | $3,750 | $21,393 |
| 2013 | $3,756 | $25,143 | $3,750 | $21,393 |
Source: Public Records
Map
Nearby Homes
- 3036 N Long Ave
- 5335 W Barry Ave
- 5244 W Barry Ave
- 2939 N Lotus Ave
- 5435 W Melrose St
- 3036 N Luna Ave
- 5243 W Oakdale Ave
- 3043 N Laramie Ave Unit 2
- 3045 N Laramie Ave Unit 2
- 5303 W George St
- 5254 W Wolfram St
- 4918-22 W Diversey Ave
- 5041 W Fletcher St
- 5038 W Nelson St
- 5042 W Wellington Ave
- 5121 W Henderson St
- 5155 W Roscoe St
- 5021 W Nelson St
- 5505 W Parker Ave
- 5233 W Parker Ave
- 5347 W Fletcher St
- 5343 W Fletcher St
- 5355 W Fletcher St
- 5341 W Fletcher St
- 5337 W Fletcher St
- 5348 W Barry Ave
- 5352 W Barry Ave
- 5346 W Barry Ave
- 5335 W Fletcher St
- 5354 W Barry Ave
- 5342 W Barry Ave
- 5340 W Barry Ave
- 5331 W Fletcher St
- 3105 N Long Ave Unit 7
- 3105 N Long Ave Unit 1
- 3105 N Long Ave Unit 2
- 5336 W Barry Ave
- 3107 N Long Ave Unit 1
- 3107 N Long Ave Unit 2
- 5348 W Fletcher St