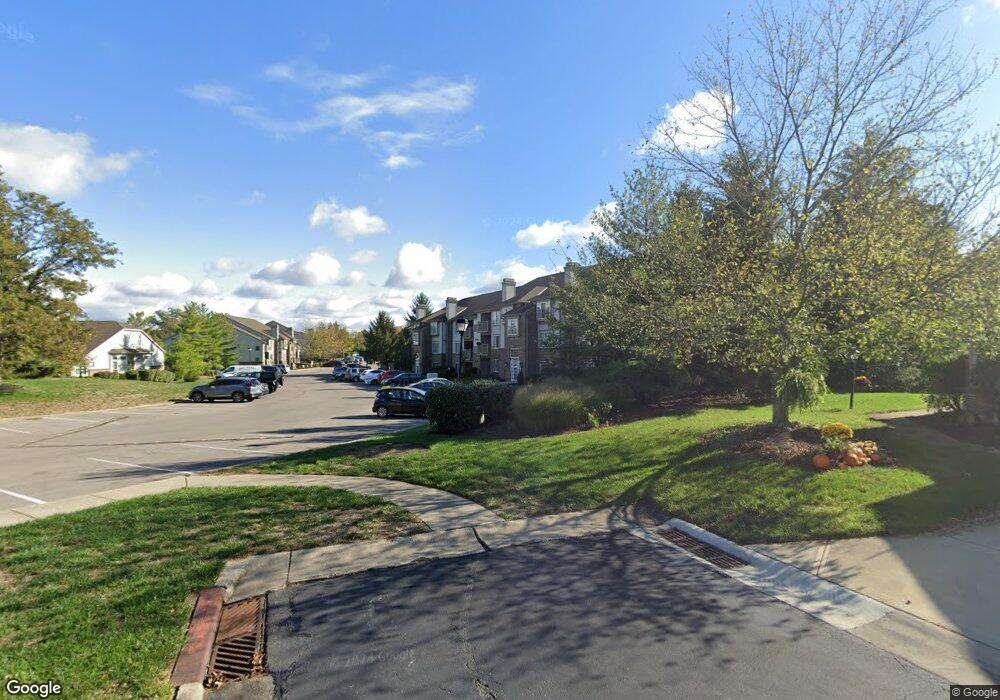
535 Cloverfield Ln Unit 204 Fort Wright, KY 41011
Estimated Value: $165,000 - $187,650
2
Beds
2
Baths
1,230
Sq Ft
$147/Sq Ft
Est. Value
About This Home
This home is located at 535 Cloverfield Ln Unit 204, Fort Wright, KY 41011 and is currently estimated at $181,163, approximately $147 per square foot. 535 Cloverfield Ln Unit 204 is a home located in Kenton County with nearby schools including Fort Wright Elementary School, Woodland Middle School, and Scott High School.
Ownership History
Date
Name
Owned For
Owner Type
Purchase Details
Closed on
Oct 17, 2014
Sold by
Almagro Anne and Almagro Rommel
Bought by
Faller Sara
Current Estimated Value
Home Financials for this Owner
Home Financials are based on the most recent Mortgage that was taken out on this home.
Original Mortgage
$82,900
Outstanding Balance
$63,672
Interest Rate
4.15%
Mortgage Type
New Conventional
Estimated Equity
$117,491
Purchase Details
Closed on
Jul 18, 2005
Sold by
Munge Leslie
Bought by
Arnold Anne
Home Financials for this Owner
Home Financials are based on the most recent Mortgage that was taken out on this home.
Original Mortgage
$86,400
Interest Rate
5.57%
Mortgage Type
Fannie Mae Freddie Mac
Purchase Details
Closed on
Jul 26, 2004
Sold by
Berberich Amy M
Bought by
Mungle Leslie
Home Financials for this Owner
Home Financials are based on the most recent Mortgage that was taken out on this home.
Original Mortgage
$77,149
Interest Rate
4.75%
Mortgage Type
Purchase Money Mortgage
Create a Home Valuation Report for This Property
The Home Valuation Report is an in-depth analysis detailing your home's value as well as a comparison with similar homes in the area
Home Values in the Area
Average Home Value in this Area
Purchase History
| Date | Buyer | Sale Price | Title Company |
|---|---|---|---|
| Faller Sara | $87,900 | Lawyers Title Cincinnati Inc | |
| Arnold Anne | $108,000 | Classic Title Agency Llc | |
| Mungle Leslie | $97,000 | Advanced Land Title Agency |
Source: Public Records
Mortgage History
| Date | Status | Borrower | Loan Amount |
|---|---|---|---|
| Open | Faller Sara | $82,900 | |
| Previous Owner | Arnold Anne | $86,400 | |
| Previous Owner | Mungle Leslie | $77,149 | |
| Closed | Mungle Leslie | $15,001 |
Source: Public Records
Tax History Compared to Growth
Tax History
| Year | Tax Paid | Tax Assessment Tax Assessment Total Assessment is a certain percentage of the fair market value that is determined by local assessors to be the total taxable value of land and additions on the property. | Land | Improvement |
|---|---|---|---|---|
| 2024 | $1,324 | $129,200 | $0 | $129,200 |
| 2023 | $1,033 | $92,200 | $0 | $92,200 |
| 2022 | $1,062 | $92,200 | $0 | $92,200 |
| 2021 | $1,083 | $92,200 | $0 | $92,200 |
| 2020 | $1,094 | $92,200 | $0 | $92,200 |
| 2019 | $1,049 | $87,900 | $0 | $87,900 |
| 2018 | $1,052 | $87,900 | $0 | $87,900 |
| 2017 | $1,024 | $87,900 | $0 | $87,900 |
| 2015 | $983 | $87,900 | $0 | $87,900 |
| 2014 | $1,175 | $108,000 | $0 | $108,000 |
Source: Public Records
Map
Nearby Homes
- 535 Cloverfield Ln Unit 202
- 556 Cloverfield Ln Unit 303
- 485 Cloverfield Ln
- 109 Fayette Cir
- 1242 E Henry Clay Ave
- 1216 E Henry Clay Ave
- 1732 Highland Ave
- 81 Kyles Ln
- 814 Monte Ln
- 108 Kennedy Rd
- 65 W Crittenden Ave
- 906 Treeline Dr
- 603 St Joseph Ln
- 2724 Latonia Ave
- 2742 Latonia Ave
- 2237 Wideview Dr
- 2755 Dakota Ave
- 2733 Alexandria Ave
- 2001 Pieck Dr
- 797 Highland Ave
- 535 Cloverfield Ln Unit 303
- 535 Cloverfield Ln Unit 301
- 535 Cloverfield Ln Unit 203
- 535 Cloverfield Ln Unit 103
- 535 Cloverfield Ln Unit 102
- 535 Cloverfield Ln Unit 101
- 535 Cloverfield Ln Unit 302
- 535 Cloverfield Ln Unit 201
- 535 Cloverfield Ln Unit 104
- 535 Cloverfield Ln Unit 304
- 535 Cloverfield Ln
- 580 Cloverfield Ln Unit 301
- 580 Cloverfield Ln Unit 204
- 580 Cloverfield Ln Unit 203
- 580 Cloverfield Ln Unit 202
- 580 Cloverfield Ln Unit 103
- 580 Cloverfield Ln Unit 102
- 580 Cloverfield Ln Unit 101
- 576 Cloverfield Ln Unit 308
- 576 Cloverfield Ln Unit 307