Estimated Value: $624,000 - $753,000
6
Beds
4
Baths
3,348
Sq Ft
$210/Sq Ft
Est. Value
About This Home
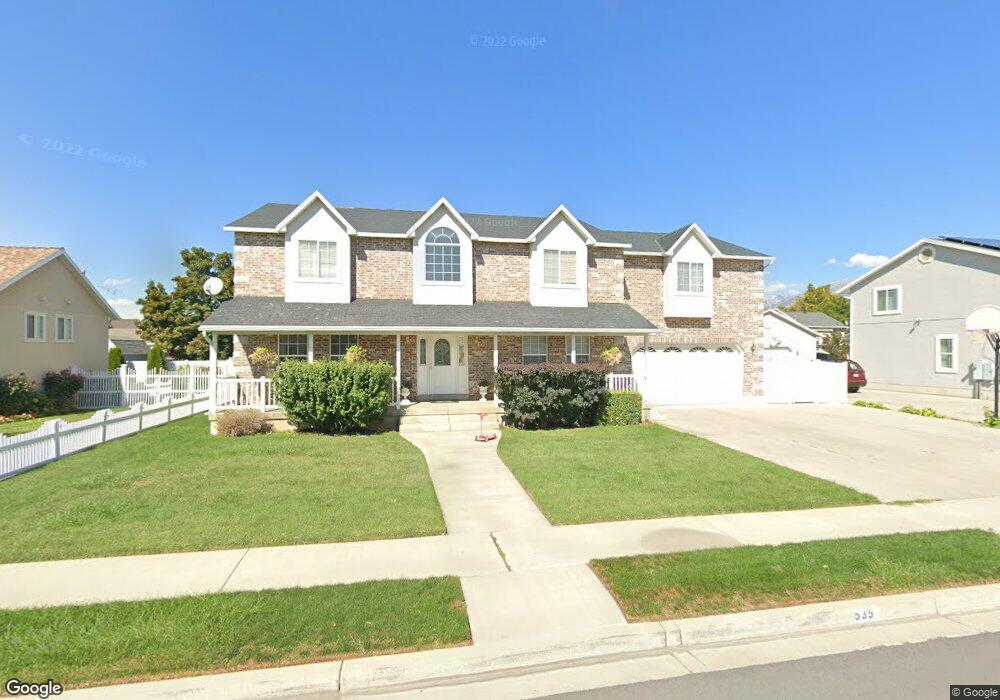
This home is located at 535 E 400 S Unit 4, Lehi, UT 84043 and is currently estimated at $704,511, approximately $210 per square foot. 535 E 400 S Unit 4 is a home located in Utah County with nearby schools including Meadow Elementary School, Lehi Junior High School, and Lehi High School.
Ownership History
Date
Name
Owned For
Owner Type
Purchase Details
Closed on
Nov 13, 2023
Sold by
Innes James W and Innes Jo Ann
Bought by
Innes Living Trust and Innes
Current Estimated Value
Purchase Details
Closed on
Jun 3, 2020
Sold by
Innes James W and Innes Jo Ann
Bought by
Innes James W and Innes Jo Ann
Home Financials for this Owner
Home Financials are based on the most recent Mortgage that was taken out on this home.
Original Mortgage
$237,650
Interest Rate
3.2%
Mortgage Type
New Conventional
Purchase Details
Closed on
Mar 19, 2019
Sold by
Innes James W and Innes Jo Ann T
Bought by
Innes James W and Innes Jo Ann
Purchase Details
Closed on
Dec 27, 2018
Sold by
Innes James W and Innes Jo Ann T
Bought by
Innes James W and Innes Jo Ann
Purchase Details
Closed on
Aug 7, 2000
Sold by
Taylor Jerry L
Bought by
Innes James W and Innes Jo Ann T
Create a Home Valuation Report for This Property
The Home Valuation Report is an in-depth analysis detailing your home's value as well as a comparison with similar homes in the area
Home Values in the Area
Average Home Value in this Area
Purchase History
| Date | Buyer | Sale Price | Title Company |
|---|---|---|---|
| Innes Living Trust | -- | None Listed On Document | |
| Innes James W | -- | Advantage Title Llc | |
| Innes James W | -- | None Available | |
| Innes James W | -- | None Available | |
| Innes James W | -- | Summit Title Co |
Source: Public Records
Mortgage History
| Date | Status | Borrower | Loan Amount |
|---|---|---|---|
| Previous Owner | Innes James W | $237,650 |
Source: Public Records
Tax History Compared to Growth
Tax History
| Year | Tax Paid | Tax Assessment Tax Assessment Total Assessment is a certain percentage of the fair market value that is determined by local assessors to be the total taxable value of land and additions on the property. | Land | Improvement |
|---|---|---|---|---|
| 2025 | $2,757 | $332,420 | $180,100 | $424,300 |
| 2024 | $2,757 | $322,685 | $0 | $0 |
| 2023 | $2,683 | $340,945 | $0 | $0 |
| 2022 | $3,167 | $390,170 | $0 | $0 |
| 2021 | $2,935 | $546,500 | $104,200 | $442,300 |
| 2020 | $2,770 | $509,900 | $96,500 | $413,400 |
| 2019 | $2,383 | $456,000 | $96,500 | $359,500 |
| 2018 | $2,351 | $425,300 | $96,500 | $328,800 |
| 2017 | $2,101 | $202,070 | $0 | $0 |
| 2016 | $2,161 | $192,885 | $0 | $0 |
| 2015 | $2,002 | $169,620 | $0 | $0 |
| 2014 | $1,996 | $168,080 | $0 | $0 |
Source: Public Records
Map
Nearby Homes
- 535 E 400 S
- 551 E 400 S
- 551 E 400 S Unit 3
- 515 E 400 S
- 515 E 400 S Unit 5
- 526 E 350 S
- 544 E 350 S
- 534 E 400 S
- 534 E 400 S Unit 10
- 508 E 350 S
- 550 E 400 S
- 550 E 400 S Unit 11
- 500 E 400 St S Unit 13
- 516 E 400 St S Unit 9
- 500 E 400 St S Unit 2
- 569 E 400 S
- 562 E 350 S
- 505 E 400 S
- 505 E 400 S Unit 6
- 415 S 500 E