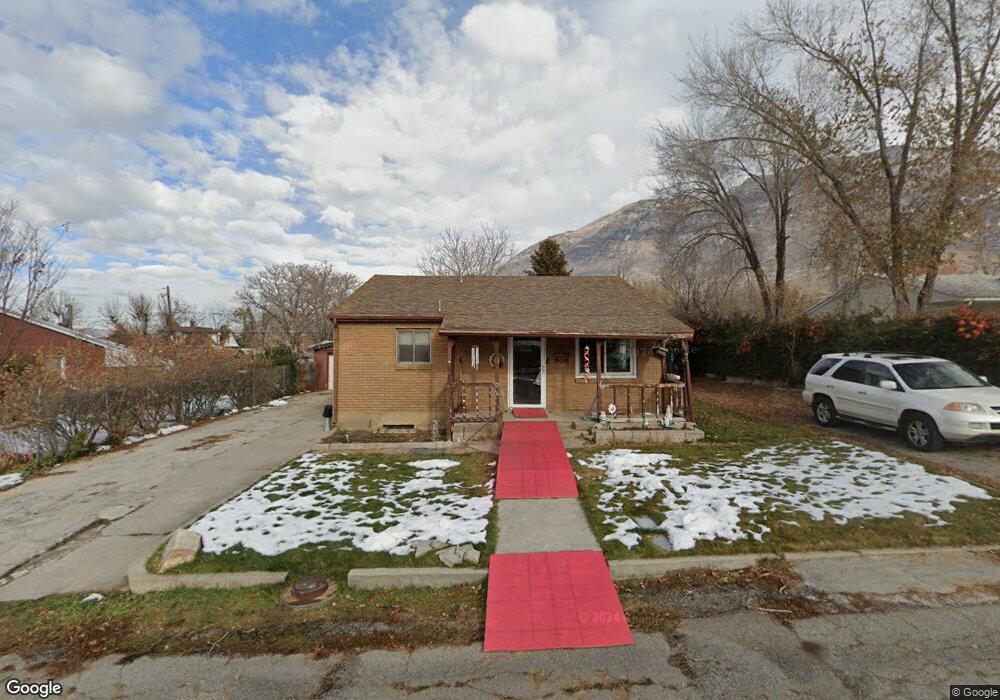
535 E 600 N Pleasant Grove, UT 84062
Estimated Value: $438,000 - $551,000
4
Beds
2
Baths
924
Sq Ft
$522/Sq Ft
Est. Value
About This Home
This home is located at 535 E 600 N, Pleasant Grove, UT 84062 and is currently estimated at $482,068, approximately $521 per square foot. 535 E 600 N is a home located in Utah County with nearby schools including Grovecrest Elementary School, Pleasant Grove Junior High School, and Pleasant Grove High School.
Ownership History
Date
Name
Owned For
Owner Type
Purchase Details
Closed on
Jun 12, 2019
Sold by
Mitchell Betty N
Bought by
Mitchell Betty N and Betty N Mitchell Living Trust
Current Estimated Value
Purchase Details
Closed on
Jul 18, 2000
Sold by
Budge Eric S and Budge Jennifer L
Bought by
Estrada Rebecca
Home Financials for this Owner
Home Financials are based on the most recent Mortgage that was taken out on this home.
Original Mortgage
$196,013
Outstanding Balance
$71,729
Interest Rate
8.55%
Estimated Equity
$410,339
Purchase Details
Closed on
Jan 20, 1999
Sold by
Fowlke Lorie D
Bought by
Budge Eric
Purchase Details
Closed on
May 14, 1998
Sold by
Budge Eric
Bought by
Budge Eric S and Budge Jennifer L
Home Financials for this Owner
Home Financials are based on the most recent Mortgage that was taken out on this home.
Original Mortgage
$151,200
Interest Rate
7.13%
Mortgage Type
Balloon
Create a Home Valuation Report for This Property
The Home Valuation Report is an in-depth analysis detailing your home's value as well as a comparison with similar homes in the area
Home Values in the Area
Average Home Value in this Area
Purchase History
| Date | Buyer | Sale Price | Title Company |
|---|---|---|---|
| Mitchell Betty N | -- | None Available | |
| Mitchell Betty N | -- | None Available | |
| Estrada Rebecca | -- | Empire Land Title Company | |
| Budge Eric | -- | Mountain West Title Co | |
| Budge Eric S | -- | Inwest Title Services Inc |
Source: Public Records
Mortgage History
| Date | Status | Borrower | Loan Amount |
|---|---|---|---|
| Open | Estrada Rebecca | $196,013 | |
| Previous Owner | Budge Eric S | $151,200 |
Source: Public Records
Tax History Compared to Growth
Tax History
| Year | Tax Paid | Tax Assessment Tax Assessment Total Assessment is a certain percentage of the fair market value that is determined by local assessors to be the total taxable value of land and additions on the property. | Land | Improvement |
|---|---|---|---|---|
| 2025 | $380 | $229,515 | $209,100 | $208,200 |
| 2024 | $380 | $217,250 | $0 | $0 |
| 2023 | $392 | $219,945 | $0 | $0 |
| 2022 | $566 | $220,550 | $0 | $0 |
| 2021 | $412 | $289,400 | $150,000 | $139,400 |
| 2020 | $444 | $260,600 | $133,900 | $126,700 |
| 2019 | $1,243 | $233,200 | $123,000 | $110,200 |
| 2018 | $352 | $212,900 | $112,200 | $100,700 |
| 2017 | $1,058 | $99,935 | $0 | $0 |
| 2016 | $167 | $96,910 | $0 | $0 |
| 2015 | $282 | $96,910 | $0 | $0 |
| 2014 | $287 | $90,255 | $0 | $0 |
Source: Public Records
Map
Nearby Homes